A picture is worth a thousands words, and this map shows the loss of a couple of hundreds of thousands of jobs. This map shows the current unemployment in each of the 50 states, and in 13 of them, that rate is above 10%.
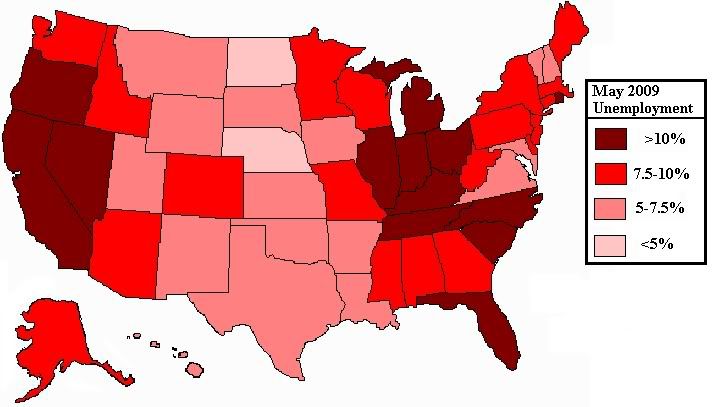
At least in part, this map shows the immediate impact of the shutdown of much of the US auto industry. With most GM and Chrysler plants idled beginning in early may, a large number of parts suppliers have followed suit. As a consequence, the industrial region around the Great Lakes has seen unemployment jump to heights not seen since the late 1970s.

Recent comments