
A frequent meme propounded in the economic blogosphere is that U6 unemployment, running near 17% now, is a truer measure (and there are good reasons to believe it is), so that means we have unemployment already approaching Great Depression levels of 25%. Left out of the comparison is the fact that U3 and U6 measurements didn't exist during the 1930s. So, is the 25% unemployment peak for the Great Depression a fair comparison to U6 unemployment today?
N. Andrews compared historical versions of unemployment statistics with the modern U3 and U6 versions, published as "Historical Unemployment in Relationship to Today" , has an answer. He writes:
For the period of 1900 - 1947 we have two unemployment statistics available, Unemployed Non-Farm employees and Unemployed Civilian Workforce. These two data sets pose a challenge as they were developed during a period of ever-changing data collection methodologies. The data in the sets has been adjusted by the sources listed in Bicentennial Edition: Historical Statistics of the United States, Colonial Times to 1970 in an attempt to sync the data sets with the methodology that was put in place as of 1940 and was the basis for methodologies since. We can compare the two available data sets ... and we see that the Unemployed Non-Farm employees and Unemployed Civilian Workforce measures of unemployment appear to be a close analogue of modern U3 (Unemployed Civilian Workforce) and U6 (Non-Farm employees).
Based on that research, he was able to generate a mathematical formula to calculate U3 and U6 unemployment for the entire period since 1900. He found that at the peak of the Great Depression, U3 was 25.2%. U6 was 37.6%.
Here's the resulting graph:
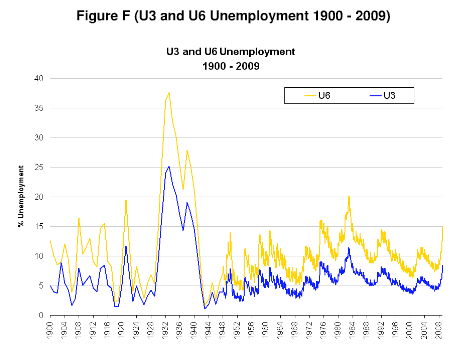
If Nelson is correct, the notion in the blogosphere that current U6 unemployment levels are close to those of the Great Depression appears to be false, and indeed, far off the mark. Using Nelson's methodology, our currrent U3 and U6 unemployment are both very close to the figures in 1930, which is bad enough. But they are less than half of the unemployment that existed at the peak of the Great Depression.
Comments
Are there a lot of people that think UM is close
to the Great Depression. Most of what I've read people are watching them getting closer but not there yet. I for one do rant a bit about how the general public doesn't even know U6 exists and the media doesn't help give out such information.
The great depression didn't have the long term effect of outsourcing jobs. It is something that is still marching forward and taking "green" jobs with it.
nice correction NDD
While this situation is bad, bad data is bad data. Nice exposure to Andrews work. I had wondered about the unemployment stat. methods have been changed repeatedly and how to adjust in order to obtain historic scale.
Although today, where are the "self employed" in these numbers? There are hundreds of thousands of contractors out there who are really temps., but they are counted as small businesses and thus do not go into the unemployment statistics.
Yeah I am one of those 1099 types
and if I fail I am not even a blip on the radar. My two sisters are 1099 people. One sisters husband is a Realtor and he is sitting with no sales basically unemployed but won't show up on any reports. I know many, many small subcontractors that haven't had work in almost a half year.
Robert, you are correct in wondering because we live/work in a different manner than we did at the time of the Great Depression.
tis true
one of us needs to research this out and when I say research, I mean to the level of a NDD post (he really researches out his stats). For this use of 1099-misc. as a way to underpay workers is rampant.
any statistics are
any statistics are apple/orange comparisons, as you are trying to contrast stats that are not comparable in any way..
you are contrasting a period in which the overwhelming majority of goods sold in the usa were manufactured and produced in the usa by americans,
and also a era in which it was quite commonplace for a significant pct. of the population to 'work' off-the-books for cash, and usually for irregularly/seasonal periods.. any 'stats' from this period are virulently questionable and certainly INCOMPLETE, if not outright inaccurate, as by our standards today, a large part of the work force working a procession of travelling labor jobs for cash would not be 'seen' as employed at all.
in the current era, we have been on a multi-decade crusade to denude our nation of its primary economic base, and employment base,
Our 'leaders' reclassify hamburger-making as a ''manufacturing'' job during Bush Admin desperation to paint a false face on the consequences of their economic offshoring,
and none of the above has any precendent or counterpart in the earlier Depression.
We are now also a entirely fiat currency underwritten state, whereas even the poorest WPA laborer had a dollar in his pocket come payday that consisted on what in that era was a dollars-worth of silver, so there was inherent valuation still present in that time, as opposed to govt assurances from a president that rules a debtor state with no hard asset beedrock supporting the markets accepted currency valuations of a pack of scurrilous, mercenary traders..
Curious artifact
One thing that immediately pops out at me regarding Andrews' data (graphs) is that the U3 and U6 plots are identical throughout the entire time period being measured (with U6 only being an expanded version of U3, as if one merely turned up the volume of U3 on an oscilloscope). Look closely, even the smallest of details is mimicked in the U6 data. Are we to believe that the two can be tied so consistently for over so long a time, with never a hint of one lagging or leading the other? I for one would be most interested in the methodology in how these data were actually calculated and finalized, as it appears that only superficial estimates were used to expand and/or fabricate existing numbers; in other words, no new data or data assessment appears to be present.
I believe it
Because U3 is merely the sanitized-for-public-consumption version of U6. The methodology of collecting the data is *exactly* the same, the only difference between U3 and U6 are some pretty constant superficial differences.
-------------------------------------
Executive compensation is inversely proportional to morality and ethics.
-------------------------------------
Maximum jobs, not maximum profits.
There are three other
There are three other factors that are being omitted here: percentage of women in the workplace compared from 2009 to 1929-1933, average wage comparison between 2009 and 1929-1933, and cost of living expenses.
Until all of these three factors are successfully enveloped into the equation, it's incredibly difficult to determine just how bad our current economic status is in comparison to the Depression.
Numbers
While it would be great to have the "real" numbers, I think we don't need them to understand the problem as a whole, which is horrible policy. We suck from the teat of our giant economy, thinking we can have bad policies because our economy is so strong to be able to withstand. Now we are forced to see that our policies, both Republican and Democrat, continue to grow our government, increase corruption, and diminish freedom.
Not the same
You have to also remember (or learn) that there are close to, if not over, 100 million people in this country today that do not and never will work and they are not counted as unemployed. It was a completely different culture in the late 20's/early 30's. The attitude then was you either work or you starve. The entitlement programs that have put tens of millions of Americans on easy street simply didn't exist then. Handicapped people didn't live long and productive lives. There was the occasional sanitarium but the huge majority of those not able to care for themselves simply perished.
If you add the entitled never-employable people to our unemployment numbers we are over 60% unemployed.
that's a pretty incredible accusation
and one that is dead wrong. Firstly women were not in the workforce, secondly disabled are somehow "entitled"? Give me a break! How heartless can one be? Then blacks worked, worked like dogs and were also not counted. Entitlement...oh yeah those lazy bums. Merry Christmas to you, glad you have a sense of reality and the phrase, "there but for the grace of God go I".
Easy Street?
Where is this Easy Street? I would hate to have to live on the meager entitlements many of them get. You forgot to mention the large number of retired -- they've got their nerve ignoring the actuarial tables Bismark used. But once people are out of the labor force, it's not an easy thing to get back in. While some are unable to work because of disease or injury, I would hasten to add that work itself is part of the value one gets in life. I would hate to spend my days watching Jerry Springer -- if that's Easy Street, you can have it. But we have a lot of misconceptions about the poor and disabled, and there is a whole literature on the physical and mental health of the poor. You make a valid point that there has been a change in the way we treat the poor and disabled. I've always found it interesting that when Ronald Reagan became president, he stopped talking about the "Welfare Queen." That was about the time David Stockman discovered that ketchup was a vegetable in school lunches.
Frank T.
Frank T.
things to keep in mind
Andrews seems to make the case that since the difference between the Unemployed Non-Farm employees and Unemployed Civilian Workforce measures of unemployment are related by a factor similar to that of modern U3 and U6 then they must be decent analogs. The difference factor between the U4 and U6 data from 1994 to 2010 is 1.68. Why does Andrews not assume that the two historical values are analogs for these modern values? In addition, U6 is not a measure of unemployment. It includes individuals who settle for part time work due to economic reasons. A true measure based on data provided by the Bureau of Labor and Statistics is not possible due to the fact that data about workers who have been discouraged for over a year are not recorded. The BLS data can however be used to compute what is essentially a U5.5. This includes all individuals who are available for and want to work but do not currently have a job. This value showed december unemployment and 13%.
Great Depression unemployment did not hit its depth until 1934
We still have a few years
employment report
It is very difficult to rationalize the jobs report. The fact is that unemployemnt increased by 134000 between february and March. In addition there has been a steady decline in the size of the registered labour force- 398,000 fewer people in the civilian labour force. In addition there is an increase of 546,000 people on benefits 0-26 weeks and a sharp decline of 414000 people on claims over 27 weeks- there are but three explanations 1) data error 2) these people have returned to work or 3) they have run out of benefits and disappeared from the sytstem. The labour department has these statisitics- they know if a claimant has returned to work based on their ssn but they clearly chose not to release the data in a language that tells the real state of affairs.
The united states in entering a stage of the frightening reality that unemployment is way beyond 10% - in all liklihood given the length of the recession and fact that hundreds of thousands or millions of americans are running out of benefits, a cynical embellishment of 162,000 new jobs being created almost all by government programs and temporary at that is an indictment of economic collapse and that if we are to be seduced by this idea of global economic recovery we have given up all pretence of deductive intelligence
The ecomomic situation is so bad that unrestricted printing of money to fund programs and debt is not even inflationary- problem a strong case for deflation and the Great Depression we are really in on this side of the hemisphere- we could say thank the powers that be that we have asia on a rampage, but the idea that production can be transferred globally to one country with a large and cheap labour force and not not have irreversible repurcussions on every greedy capitalistic economy around the globe is pure insanity.
what's next- hey there is no bandaid- no koolaid- no US aid- only the stark ugly truth that whatever happens it will be the consequence of unmanageable human greed- whereever.
What about HouseHold Survey based on Population (Census)
Has anyone seen a work up of the household surveys with a work
up of the numbers based upon ths workforce as a percent of population? There are still the problems of defining who is working
Burton Leed
household census
Firstly, see that "reply" link? You need to click that to reply to a comment. Comments are threaded and tracked but only when one hits the reply. If you don't hit reply then in "my account", you cannot see if you have a reply to your comment.
Every month when the unemployment report comes out, I write up and midtowng also often writes up an analysis of the report.
See Uemployment March 2010 and there are monthly reports in the same forum category (or should be the same, labor economics).
In each one are civilian population, those changes, the "missing", U6, workforce size and so on, all about capturing the not reported. The under-employed is another category. This is when you've got say a PhD in Physics working at the home depot. That person is counted as a retail sales worker, instead of an unemployed physicist and it's much harder to show those numbers, mainly because the BLS only does yearly occupational categories and even worse, they count foreign guest workers (the dual of offshore outsourcing) in their employment stats, which artificially represses the real unemployment rates and underemployment is "swept under the rug".
I have a tendency to ignore initial unemployment claims because it's always revised to look better than last week and has some serious data anomalies that one needs to look at. It's at best a very rough indicator and also had to be taken on an average. Way too much noise in it to think the weeklies are accurate indicators in my view.
U-6
I find some of this interesting but there is no way U-6 was 37.6%, ever. Historical records do not support this. Unemployment stats included 14 year olds in the 1930's, male and female. Did this new deal author adjust for that? What is the reality of todays job market is this. Career jobs are vanishing and if a new job is created it is not a career job(min wage). This will have long term effects on the American economy that most people are just now realizing. I find it ironic that millions of college students are trying to become more marketable for a min wage job. They must try, of course, to better there economic situation, but the reality is not a lack of an educated workforce its a gap in opportunities available. I have a couple degrees, so I'm trying not to make any spelling or grammitical errors here, but I am no more marketable than say my spouse who has little formal education but has some skills. Last summer I applied for several teaching jobs one being for a Florida charter school. I am certified to teach in several arears (Science and all Social Studies) so I thought I might stand a reasonable chance. After applying, I contacted the principal who, in turn replied, "you are one of 540 applicants". This was for 3 teaching positions. Sounds like 1930's to me. Hell, The school only had 200 students. The school staff, (2) people, were unable to handle the flood of phone calls and paperwork (7 page application X 540)so they hired a selection team to accomplish the task at hand. All this competition for 3 $35K jobs. Maybe I should have applied for the impending "selection team".
Companys are now learning to do more with less, even if business picks up they can hire "temp" very low paid workers to fill any additional increase in workload, then just lay them off during slowdowns. This is the new way of managing a workforce and it will stay this way for many years to come(10-20 years or more). This is very creepy to dwell on, but this is the new American economy for this generation. In a couple more years back yard BBQ's conversations everywhere will go like this, "Hey Bob what have you been up to?" Bob excited, said, "Well, Jim I had a good week. First I mowed Jane's yard on Monday, then I sub taught on Tuesday and Thursday, on Friday I traded some can goods for 2 gallons of gas and a fan belt and put in 42 job apps, and finally on saturday I did some census work. A $318 week! I wish every week was like this!"
Great Depression vs Today
While percentages are interesting to discuss, isn't today's percentages more or equaly dangerous today because the population is soooo much bgger today and the skills necessary to make a living wage areharder to come by? Also, we don't see as many stories about homeless or soup lines because people are defaulting their mortgages, living rent free during a 2 year backlog of foreclosures combined with extended unemployment benefits that neither existed during he great drepression?
Graph
The graph doesn't cover up to 2010. 1984 u6 matches 1927 u6 for a short period. Society is different. I.E. back then if you needed a house the community would get together dig a basement with shovels and then build you a house for a few thousand, well much cheaper than what it is today. Comparing these things are apple to oranges. The biggest thing that I'm trying to say is social factors are not taken into account. Women work now for instance. Woman may still have a social fabric as social customs linger.
Underground Ecomony
?I wonder about the Underground Economy Workers?.
Several years ago there were all these stories about the off book workers, and were they 10% or were they 25% of the work force.
Then the Stories all disappeared, like some government department flipped a switch.
However if they weren't counted back then, and they are not counted now, ?How do whe know how they affect U-3, or U-6?
En Inglés
no tener necesidad signo de interrogación a principios de frase. (¿)
Back in the Great Depression, there was no great underground economy. There was institutionalized discrimination against Blacks, Hispanics and women, and probably noninstitutionalized discrimination against Jews, Catholics and so on. But from the 1920's, immigration laws were enforced, so a large pool of illegal workers wasn't there. I'm not sure when the IRS started collecting taxes via W-2, but Social security (FICA) taxes were not collected until 1939, and it wasn't even passed until 1935. So, how many U.S. laborers were off the books or being paid in sandwiches in the 1930's? Good question. I cannot find out how well laws were enforced, but assuredly the FDR administration did a massive clean up on labor laws and procedures...Francis Perkins really turned the DOL into something for the U.S. worker, starting in 1934.
It's true illegal workers are about 5%-9% of the total workforce and the underground economy is about 8% -14% (estimates vary widely) of GDP in 2009.
To estimate illegal labor as a percentage. Take non-institutional civilian population, 237,690,000 and then divide by the estimated # of illegals in the U.S. 22 million gives a ratio of 9.3%. Now, of those illegals, there are people who are not members of the noninstitutional population. That's kids, those in prison, and the aged. Then of the noninstitutional population, assuredly there are some who are not working for a variety of reasons, hence would not be in the labor force.
Since illegals come to the U.S. to work illegally, there probably is a larger percentage that are workers instead of kids, aged, retired than the U.S. overall population.
So, I would take the 22 million, divide it by half to give a rough estimate of 4.6% to 5.0% of the U.S. workforce.
These are very, very rough calculations, just going off of recent numbers. I couldn't find a more accurate number crunch but I am sure claiming illegals are 25% of the U.S. worker pool is way, way off.