It's a conspiracy! The BLS is trying to swing the election! They're cookin' de books! By now you've seen the claims, accusations and mumblings by the pundits, press, twitter and blogosphere. So what really happened with this month's unemployment report?
The deeper and longer the recession goes on, the more questionable the numbers get.
Today the headline number was a loss of 85,000 jobs in December and a steady unemployment rate of 10%.
The market only expected to lose 3,000 jobs, so this was a negative report. However, like most unemployment reports, the Devil is in the details.
By far the largest change in the employment numbers was the number of people no longer in the workforce. Using the non-seasonally adjusted numbers 1,027,000 people stopped being counted as part of the labor force last month even though 321,000 of them say they still want a job.
Reading government economic statistics is like listening to a used car salesman - his lies are usually of omission.
For example, look at today's news on unemployment.
There were more encouraging signs, with the number of people collecting long-term unemployment benefits dropping 98,000 to 5.92 million in the week ended Oct. 10, the latest week for which the data is available.
That was the lowest level since March and it was the first time that continuing claims fell below the 6 million mark since April.
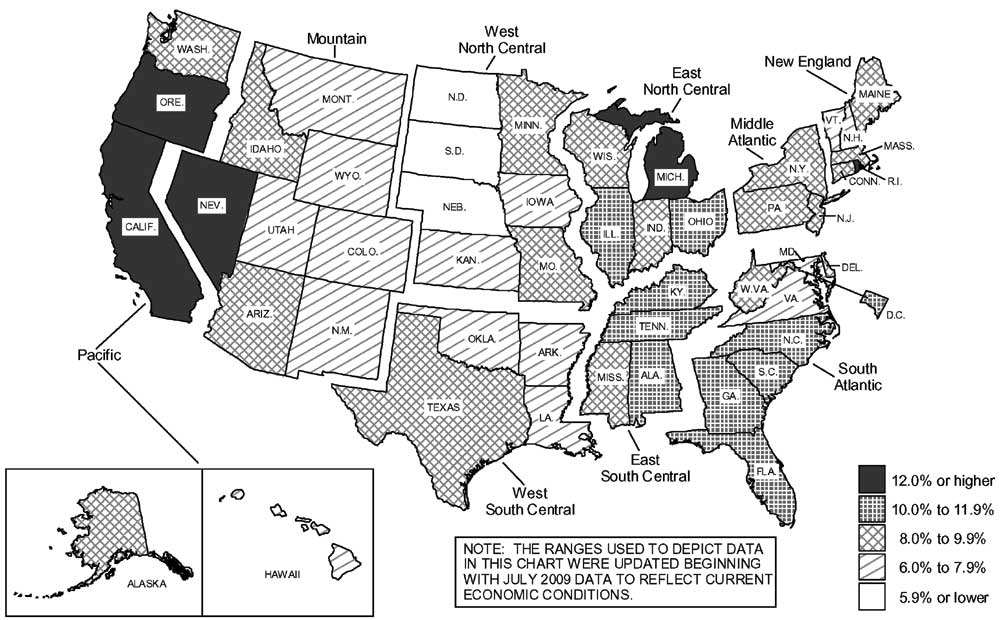
Twenty-seven states and the District of Columbia reported over-the-month unemployment rate increases, 16 states registered rate decreases, and 7 states had no rate change, the U.S. Bureau of Labor Statistics reported today. Over the year, jobless rates increased in all 50 states and the District of Columbia. The national unemployment rate rose to 9.7 percent in August, up 0.3 percentage point from July and 3.5 points from August 2008.
The overall national unemployment rate is 9.7%. Only 8 states gained jobs, 42 states continue to lose jobs.
Src: BLS, Unemployment Rates, August 2009, click on the map to enlarge
Friday is always the day for bad news and buried news and today is no exception. The BLS has unemployment statistics. Many areas are exceeding 10% unemployment rates, ya know that magic number that wasn't supposed to hit so soon. The national rate is still hovering around 9.5%.
Michigan 15.2%
Rhode Island 12.4
Oregon 12.2%
South Carolina 12.1%
Nevada 12.0%
California 11.6%
Ohio, 11.1%
North Carolina 11.0%
Florida 10.6%
Georgia 10.1%
Delaware 8.4%
It seems North Dakota is the only state with an increase, 4.2%.
Michigan jumped 1.1% in a month and so did Wyoming 0.9%, and West Virginia, 0.8%.
Regional and state unemployment rates were generally higher in June.
Thirty-eight states and the District of Columbia recorded


Recent comments