
Within the Q2 2011 Federal Reserve's flow of funds is more bad news for Americans, we're broker...er.
Household net worth—the difference between the value of assets and liabilities—was $58.5 trillion at the end of the second quarter, about $150 billion less than at the end of the previous quarter.

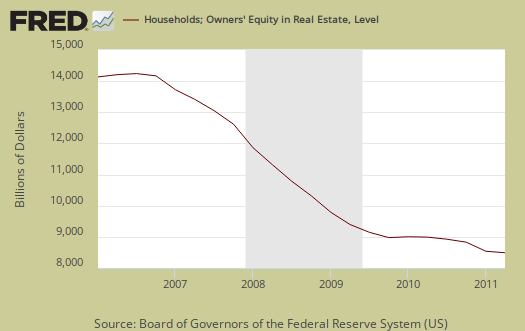
The below graph is the drop in home equity for households. Real Estate assets is where the wealth went as well as recent stock market declines:
The value of Americans’ stock portfolios fell 0.5 percent in the second quarter. Home values dropped 0.4 percent.
That's a 1.0% decline, annualized, or a -0.3% drop from last quarter in household wealth and well below 2007 levels.
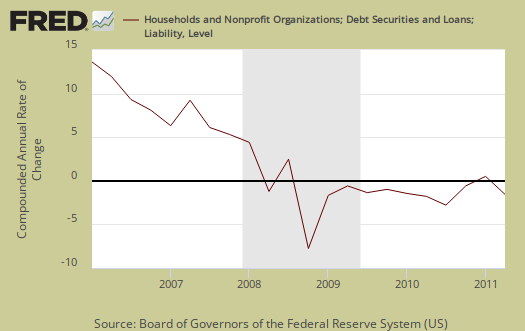
Household debt also declined another 0.5% from Q1, but the majority decline is home mortgage debt. While there is a return to 2004 debt to income ratios, those magically thinking Americans are gonna start spending ain't paying attention to the foreclosure rates.
Household debt declined at an annual rate of ½ percent in the second quarter, continuing its contraction since the first quarter of 2008. Home mortgage debt fell at an annual rate of 2½ percent in the second quarter, about the same pace of decline as in the previous quarter. In contrast, consumer credit rose at an annual rate of 3½ percent, the third
consecutive quarter of increase.
Calculated Risk calculates $6.6 trillion in real estate assets has been lost by households since 2006.
In Q2 2011, household percent equity (of household real estate) was at 38.6% - about the same as in Q1.
About 30.3% of owner occupied households have no mortgage debt as of April 2010. So the approximately 52+ million households with mortgages have far less than 38.6% equity - and 10.9 million households have negative equity.
Even worse, Calculated Risk says mortgage debt, as a ratio of GDP is still at historic highs and predicts more deleveraging (i.e. more people losing their homes) will continue.
Corporations, on the other hand, are sitting on $2047.1 billion in total liquid assets, a record high, according to the New York Post:
The Federal Reserve said in a quarterly snapshot of financial flows yesterday that US companies continued to accumulate profits instead of spending them. Holdings of cash and other liquid assets at nonfinancial companies rose to $2 trillion in April through June, up 4.5 percent compared to the first quarter. That was the highest level since the series began in 1945.
We have 14 million people officially unemployed and corporations have more cash than ever.
In another economic release real earnings dropped 0.6% for hourly and 0.8% for weekly from July to August:
Real average weekly earnings fell 0.8 percent over the month, as a result of the 0.3 percent decrease in the average workweek and the decrease in real average hourly earnings. Since reaching a recent peak in October 2010, real average weekly earnings have fallen 2.2 percent.
Recent comments