
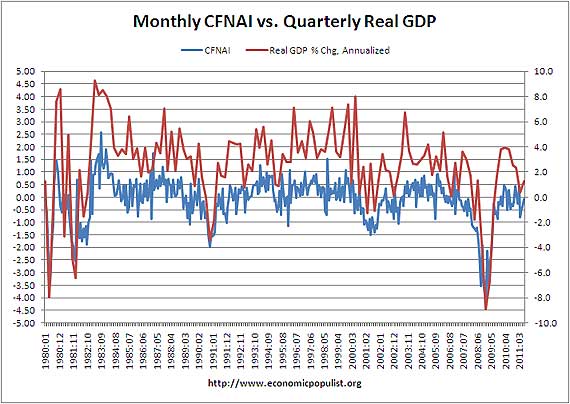
The Chicago Fed National Activity Index, often referred to as the CFNAI, was released today with a –0.06 value for July. June was -0.38, so the monthly index shows some economic conditions improved from last month, although still nothing to write home about. Below is CFNAI graphed against real quarterly GDP percent change.
Industrial production was cited as a major factor in the index improvement:
Production-related indicators made a contribution of +0.28 to the index in July, up sharply from +0.03 in June.
Here's is the definition of the index:
The CFNAI is a weighted average of 85 existing monthly indicators of national economic activity. It is constructed to have an average value of zero and a standard deviation of one. Since economic activity tends toward trend growth rate over time, a positive index reading corresponds to growth above trend and a negative index reading corresponds to growth below trend.
A zero value for the index indicates that the national economy is expanding at its historical trend rate of growth; negative values indicate below-average growth; and positive values indicate above-average growth.
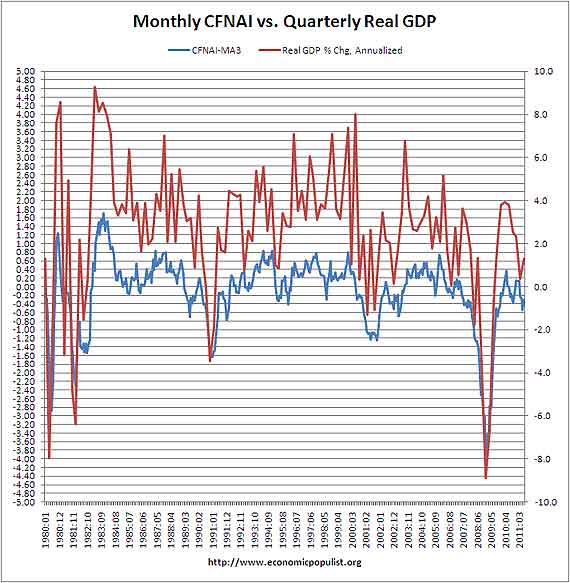
There is also a three month moving average, the CFNAI-MA3, which is used to predict economic growth by mirroring quarterly data as well as reduced monthly volatility changes.
The CFNAI-MA3 for July was -0.29, which implies low economic growth, or below it's historic trend. June's CFNAI-MA3 was –0.54.
The magic secret decoder ring to the CFNAI-MA3, , as a correlated economic predictor is:
When the CFNAI-MA3 value moves below –0.70 following a period of economic expansion, there is an increasing likelihood that a recession has begun. Conversely, when the CFNAI-MA3 value moves above –0.70 following a period of economic contraction, there is an increasing likelihood that a recession has ended. When the CFNAI-MA3 value moves above +0.70 more than two years into an economic expansion, there is an increasing likelihood that a period of sustained increasing inflation has begun.
Research into the CNFAI, or the monthly Chicago Fed index, shows it tracks well to predict future GDP growth and contraction. In fact the monthly CFNAI was used to predict slow or low GDP growth for Q1, Q2 2011 back in 2010 (see link to research). Below is a graph of the CNFAI-MA3 graphed against quarterly GDP. We can see the slope, or rate of change of CNFAI-MA3 reasonably tracks quarterly real GDP annualized percentage change.
Bear in mind this is July's data. The regional Philly Fed index plunge was based on August survey results and why the Philly Fed Business Activity Index is looked at as an early economic indicator. So, while the July monthly and three month Chicago Fed indices might cause some to breath a sigh of relief, don't hold your breath. You're gonna have to wait for August statistics to come pouring in. Anyone cheering at July's Chicago Fed numbers is smokin' more of that green shoots weed.
Out West?
Yes, looks like Philly all over again.
Let's see what the reports are from Out West.
(By 'Out West' I mean approximately the states included in the Ninth Circuit.)