
 The key monthly release of the past week was on April's Personal Income and Outlays from the BEA (Bureau of Economic Analysis), which revealed that seasonally adjusted personal income decreased at an annual rate of $5.6 billion to $13,675.1 billion, or less than 0.1%, disposable personal income (DPI), or income after taxes, decreased at a rate of $16.1 billion to $12,046.8 billion, or a bit more than 0.1%, and personal consumption expenditures (PCE) decreased at a rate of $20.5 billion to an annualized $11,739.9 billion, or roughly 0.2%. Revised figures for March showed personal income up $36.2 billion, or 0.3% over February's rate, and DPI up $25.4 billion, or 0.2%, both of which were slightly higher than the first estimate, and a somewhat lower revised spending increase of $14.2 billion, or 0.1% over February's annual rate...
April was the first month to show a decline in spending since October of last year, when spending on the east coast was curtailed due to the arrival of hurricane Sandy, and since personal consumption expenditures are still roughly 70% of GDP, this foreshadows a weakening second quarter and indicates that the expiration of the payroll tax cut and the sequester may be starting to impact the broader economy.
Of the components of personal income, private wage and salary income increased at an adjusted rate of $1.6 billion in April, while government wage & salary income increased $0.2 billion; proprietors' income decreased $8.3 billion in April, mostly because farmer's incomes fell at an annual rate of $11.3 billion, other business owners saw incomes increase $3.0 billion; rental income fell to a half billion, compared to the $12.6 billion from rentals in March, and returns on other assets increased $12.6 billion; meanwhile, personal transfer receipts decreased $13.7 billion in April, mostly due to a $9.6 billion smaller payout from social security.
Taxes took a $10.4 billion bigger bite in April than they did in March; nonetheless, adjusted for inflation, which was negative for the month, real disposable personal income increased 0.1% in April....included in the $20.5 billion decrease in personal consumption was a $4.7 billion increase in purchases of durable goods to $1,273.5 billion, a $25.0 billion decrease in purchase of non-durables, down to $2,599.4 billion, and a $4.5 billion increase in spending on services, up to $7,499.8 billion (which includes medical expenses paid for by private and government insurance); although it's not broken out, it's possible much of the spending decrease may be due to lower gas prices, which were down 8.1% for the month.
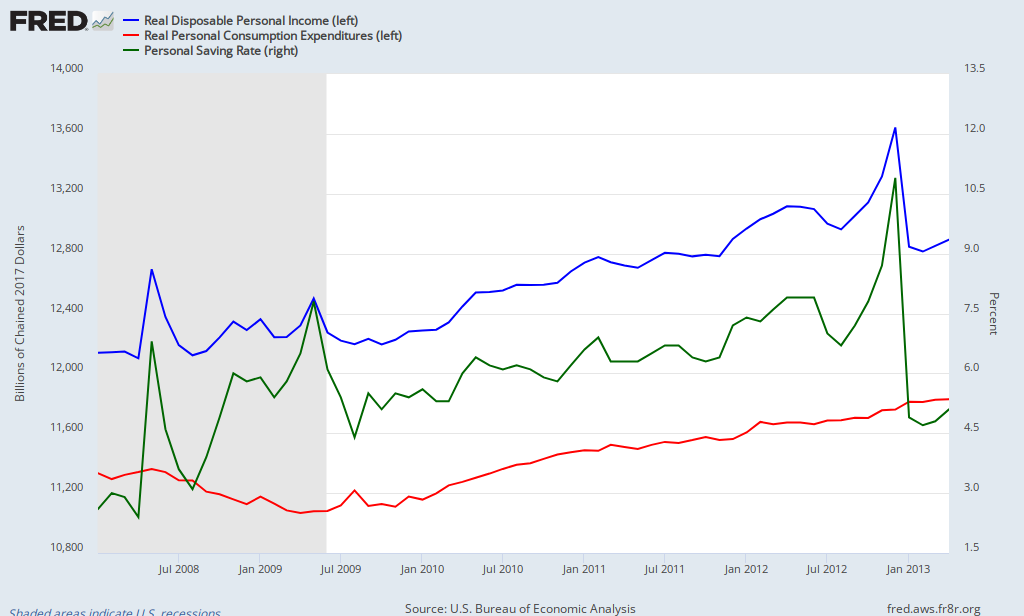
Personal outlays, which includes PCE, interest payments and personal current transfer payments decreased $21.7 billion for the month, leaving personal savings, which is disposable income less outlays, at $306.9 billion in April, up a bit from the $301.4 billion in March; nonetheless, this still left the personal savings rate, which is personal savings as a percentage of disposable income, at 2.5%, a historically unsustainable low rate, as low as any time since just before the recession started at the end of 2008...our FRED graph to the right above shows the savings rate since 2008 in green, with the scale on the left; it also shows monthly gross real disposable personal income in blue, and gross spending in red; these amounts do not take into account the increase in population; on a per capita basis, real disposable personal income is still below the levels of 2008, and only up .27% year over year...
The price index for PCE, issued with this report, showed overall prices paid for goods and services lower by 0.3%, on the heels of a 0.1% decrease in prices in March; this left the year over year change in headline inflation at 0.74%, a decrease from last month's 1.01%; year over year core PCE inflation, which excludes food and energy prices, was at 1.05%, an all time low, down from the 1.17% annual core inflation logged in March; this is the inflation measure that the Fed gears monetary policy towards, supposedly targeting a 2.5% annual increase in the price index for PCE; however, the Dallas Fed's measure of trimmed mean inflation, which "trims" the most volatile components, came in negative at –0.01 percent for April; making expectations that the Fed will pull back on QE by September increasingly unlikely..
Comments
This is fantastic analysis rjs
I overviewed PCE, personal income but you are pointing out the meat and where the changes are significant.
Too early to guesstimate what Q2 GDP component will be but sure looking like Q4!
This is great!
i hadnt seen your before i posted this..
of the reports i covered last week, i picked this one to post here because because i thought you hadnt covered it; it wasnt until after this was up that i checked my reader and saw your post on it, ~3 hours earlier...
rjs
I didn't finish it on Friday
half way completed so I finished it without checking the site. But this doesn't matter, you are adding to the fact we are seeing all over the place indicators of economic contraction, that the QE buzz is coming to an end.
Working on manufacturing ISM right now.
Not used to other contributors so my bad, try to make a point to coordinate for you are pointing out almost the same thing I am, might be more clear, I use a lot of FRED graphs as you can see.