
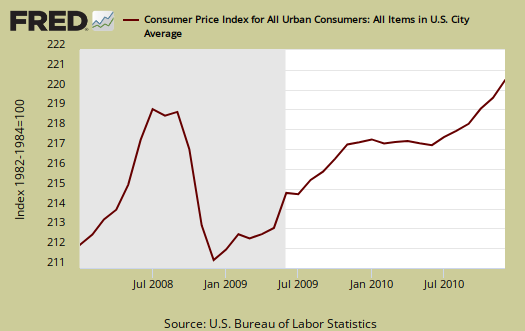
The Consumer Price Index for December 2010 increased 0.5% from last month. For the year, the Consumer Price Index for all Urban Consumers (CPI-U) has risen 1.5%. Gas alone increased 8.5% from November. Core CPI, or all items less food and energy, also increased, 0.1%, the same increase as last month. For the year, core CPI, or minus food and energy, is off it's record lows, now at 0.8%.
Below is the monthly percentage change in CPI-U.

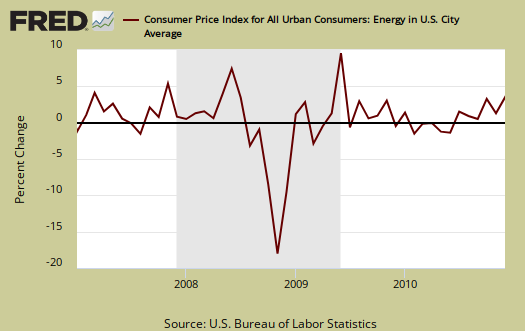
The reason for the jump in CPI is energy, which as a group increased 4.6% in a month. Gas soared 8.5% in a month, energy commodities, 7.5%, and fuel oil, 4.9%. Oil and Commodities are rearing their ugly heads and many are warning on oil prices wrecking havoc with the economy in 2011. Below are gas prices, last updated January 10th. Notice the oil bubble in early 2008.

The percent change in the CPI energy index, below, shows how the great recession actually stopped the oil bubble, which appears to be roaring back.
Core CPI's percentage change is graphed below. As we can see, overall, without energy and food, inflation is pretty tame.

Below is the St. Louis FRED graph to show the overall rate of change on core CPI, or CPI without food and energy included. Notice how the line isn't rising as fast after the dip in 2008.

The Folks who put together the CPI report added their year in review commentary, reprinted below. Firstly, it is accurate and secondly it gives a good overview on where inflation really is as well as how much oil prices come into play in inflation.
The rate of increase in the CPI slowed in 2010 as the December to December increase fell from 2.7 percent in 2009 to 1.5 percent in 2010. A deceleration in the gasoline index accounted for much of the slowdown, as it increased 13.8 percent in 2010 after rising 53.5 percent in 2009. The index for household energy, which declined in 2009, rose 0.8 percent in 2010 as increases in the indexes for fuel oil and electricity more than offset a decline in the natural gas index. The energy index as a whole, which rose 18.2 percent in 2009, increased 7.7 percent in 2010.
The index for all items less food and energy also decelerated in 2010. After rising 1.8 percent in both 2008 and 2009, the index increased 0.8 percent in 2010, the smallest December-December increase in the history of the index. Several indexes turned down in 2010. These include the new vehicles index, which fell 0.2 percent in 2010 after rising 4.9 percent in 2009, and the index for apparel, which fell 1.1 percent in 2010 after a 1.9 percent increase in 2009.
The indexes for recreation and household furnishings and operations, which both declined in 2009, posted larger decreases in 2010. The indexes for tobacco and for used cars and trucks rose in 2010, but at a slower rate than the previous year. The shelter and medical care indexes posted increases in 2010 similar to their 2009 figures. One of the few indexes to accelerate was the airline fares index, which rose 5.8 percent in 2010 after rising 4.3 percent in 2009.
The food index turned up in 2010, rising 1.5 percent after declining 0.5 percent in 2009. The index for food away from home rose 1.3 percent; the food at home index increased 1.7 percent after declining 2.4 percent in 2009. Among major grocery store food groups, the index for meats, poultry, fish and eggs posted the largest increase at 5.5 percent followed by a 3.7 percent increase in the dairy index. The indexes for nonalcoholic beverages and cereals and bakery products were the only ones to decline.
CPI-W for the month, unadjusted was 215.262, a 0.2% increase from last month.
This report is from the BLS website. These numbers are for CPI-U, whereas the metric used to calculated social security and other government payments is CPI-W.
Last month's CPI report overview is here.
Recent comments