
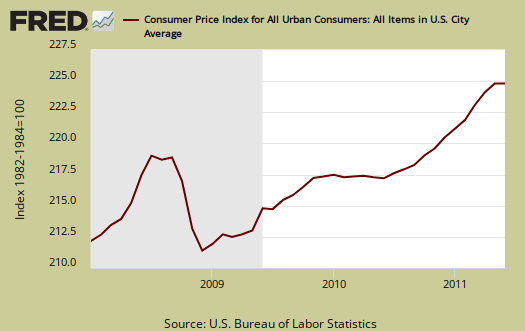
The Consumer Price Index for June 2011 decreased -0.2% from last month and it's all gas, which plunged -6.8% in a month. Core CPI rose 0.3%, the same increase as last month, which was the largest jump since July 2008. Core CPI removes food and energy cost increases and is the number the Federal Reserve watches for inflation. For the year, not seasonally adjusted, the Consumer Price Index for all Urban Consumers (CPI-U) has risen 3.6%. The May CPI monthly increase was 0.2%.
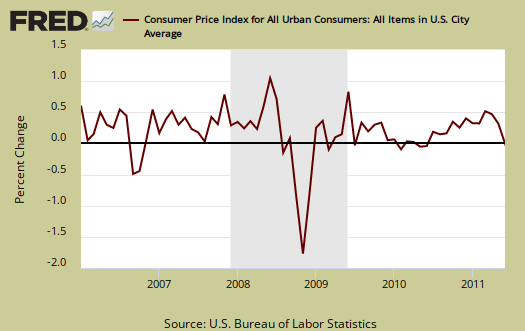
Below is the monthly percentage change in CPI-U, all items.
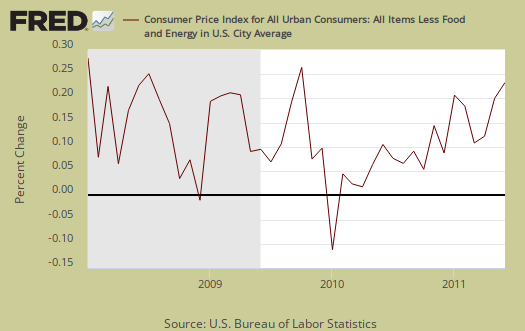
Core CPI, or all items less food and energy, is finally rearing it's ugly head. Shelter is up 0.2%, rent up 0.1%, lodging away from home up 3%, owner's rent equivalence up 0.2%, clothing up 1.4%, new and used autos increased 1.0%. About the only good news is airfare decreased 3.0% for June, although the airlines are busy shifting costs onto fee-o-rama shaft-o-matic and it's unclear if these fees are included by the BLS in airfare costs.
Core CPI's monthly percentage change is graphed below. As we can see, overall, without energy and food, inflation for the second time is showing up.
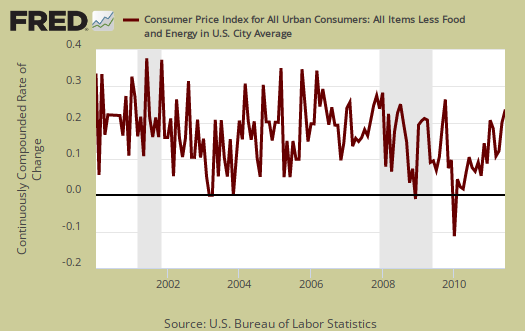
Below is the St. Louis FRED graph to show the overall index on core CPI, or CPI without food and energy included, continuously compounded rate of change Notice how the line is returning to it's rate of change, or slope, after the deceleration in 2008.
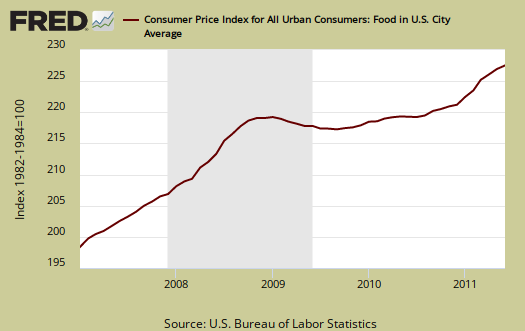
Food and beverages as well as groceries increased, 0.2% in June. Food generally increased 0.4% with eating out increasing 0.2%. For the year we have a 3.7% food index increase and if beverages are included, a 3.6% yearly increase. The graph below is food, which includes food at home and restaurants.
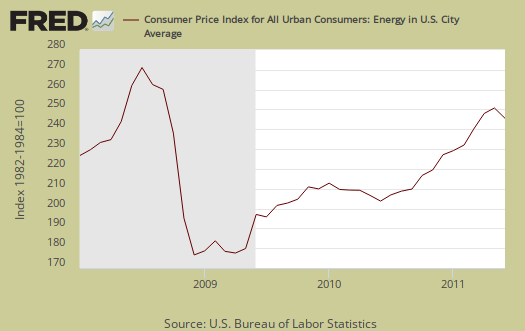
Energy overall declined -4.4% for the month but is still a whopping 20.1% for the year. This is the lowest monthly decline since December 2008. Below is the CPI-U Energy Index.
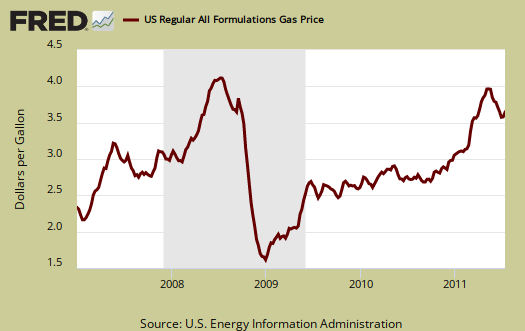
Below are gas prices, last updated May 9th. Despite this month's plunge on the gas index, it's still up 35.6% for the year. Notice the oil bubble in early 2008 and notice how close gas prices are now to that previous oil bubble. Sudden spikes in oil are highly correlated with recessions so this month's decline is some good news.
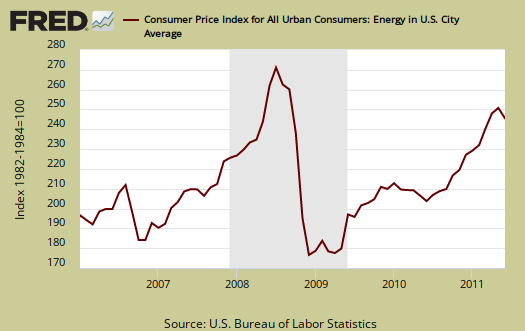
The CPI energy index, capturing the last oil bubble below, is all energy, gas, natural gas, fuel oil and so on. Notice it's dip and return versus the food index as well as how it's not as high as the CPI energy index was during the oil commodities bubble of 2008. This is why the gas plunge for this month is great news.
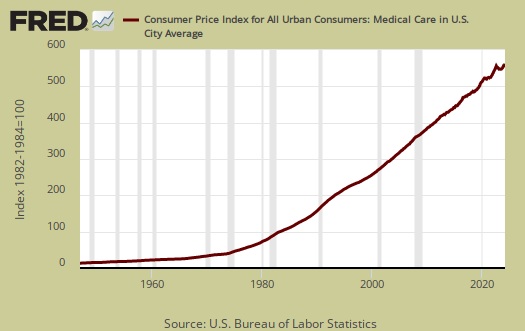
The Medical index increased 0.2% for the month and Medical care increased 0.3%. Medical commodities are things like your prescription drugs and it decreased -0.1%. Strange isn't it, that Medical care is never mentioned when referring to costs and inflation. It's only as important as food, yet health care is treated almost like it's an extra for daily living.
There has been much criticism as of late that the Federal Reserve only focuses in on core CPI, instead of food and energy. According to the BLS, Food and beverages, which includes food at home, makes up 14.8% of the index. Housing is 41.5% and transportation, including gas for the car, is 17.3%. Medical care is only 6.6%, which frankly, we hope to examine later as not being a reality percentage. All items minus food and energy are considered 77.2% of the total price expenditures for consumers.....according to them.
Regardless, this increase in core CPI will probably get the Fed's attention.
The DOL/BLS does take yearly surveys on where the money goes in the monthly budget, but as one can see, food and energy are significant amounts of the monthly finances. Run away costs in these two areas can break the bank. Considering we have price deflation in housing due to the real estate sector bubble pop, it's strange for food and energy consumer prices to be dismissed when crafting monetary policy.
Guess the concept of not having enough money for gas to get to the job interview never occurred to them.
CPI-W for the month, unadjusted was 222.522 , a -0.3% increase from last month and a 4.1% increase for the year. CPI-W is used to calculate government transfer payments, such as social security increases.
Note the the chained CPI-U also increased 0.1%, 3.5% for the year and this is not seasonally adjusted. Chained CPI is in 2005 dollar values, which has a flattening effect on real inflation.
This report is from the BLS website. These numbers are for CPI-U, whereas the metric used to calculated social security and other government payments is CPI-W.
Last month's CPI report overview, unrevised, is here.
Recent comments