
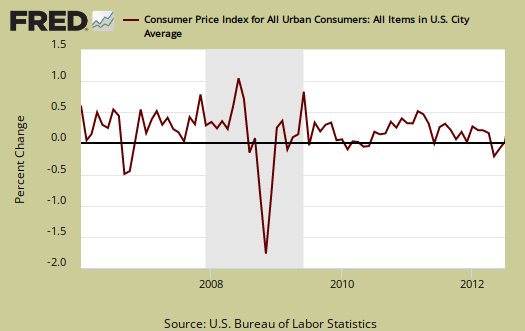
The July Consumer Price Index, which measures inflation, was unchanged from June, the 2nd month in a row. The reason was electricity costs which dropped -1.3%. Gasoline increased 0.3% for July. Removing food and energy, inflation increased 0.1% for the month. Below is CPI's monthly percentage change.
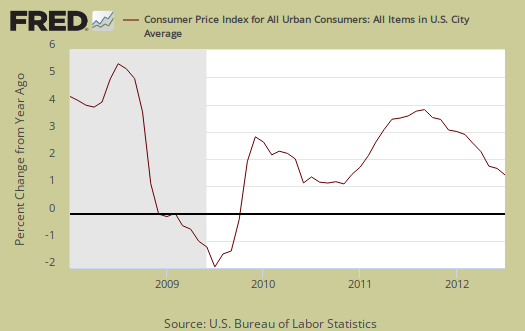
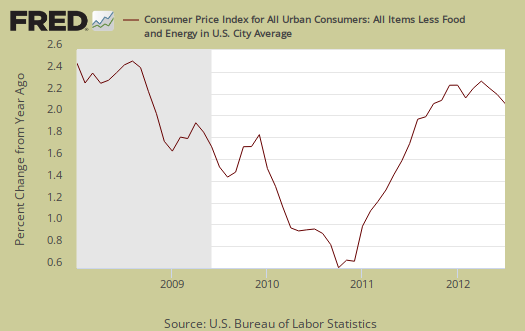
CPI is up 1.4% from a year ago, shown below. This is the lowest level of inflation since November 2010.
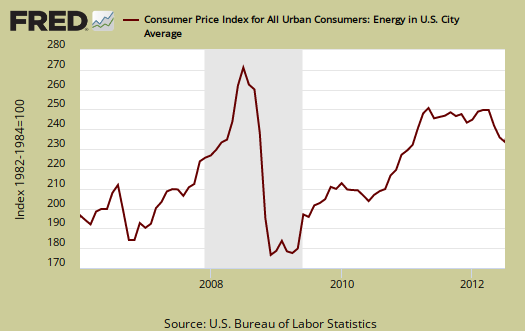
Energy overall decreased -0.3% and is down -5.0% for the last 12 months. The BLS separates out all energy costs and puts them together into one index. Energy costs are also mixed in with other indexes, such as heating oil for the housing index and gas for the transportation index. Below is the overall CPI energy index, or all things energy.
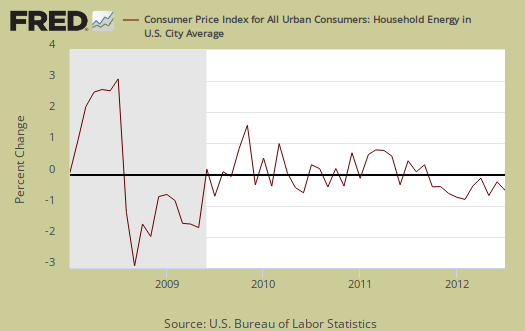
Piped natural gas declined -0.2% for the month and is down -12.7% for the year. Electricity decreased -1.3% for July and from a year ago, electricity has also declined -1.3%. Fuel oil dropped -0.5% for the month and is down -5.6% for the last 12 months. Graphed below is the household energy index which includes electricity and natural gas, shown by monthly percentage change. This month the index decreased -1.1% and for the last 12 months has declined -4.3%. This is a different, special index to show the overall costs for energy into your home.
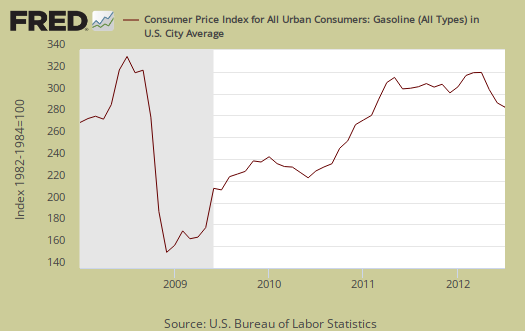
The gasoline index alone increased 0.3% for July, but is down -5.5% from this time last year, -5.7% for regular, seasonally adjusted. Graphed below is the CPI gasoline index and take a good look now because this index is going to increase later this year.
Below are gas prices, last updated August 13th. We can see gas prices are roaring back and projections are gas will stay high until at least the end of the year.

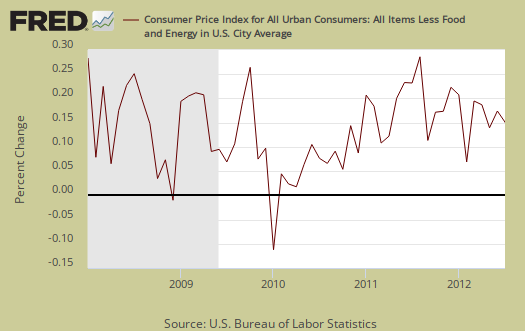
Core inflation, or CPI minus food and energy, increased 0.1% for July, a shock since core inflation has risen 0.2% for the previous four months. Core inflation has risen 2.1% for the last yearly time window. Core CPI is one of the Federal Reserve inflation watch numbers. The minute core inflation drops opens a window into more quantitative easing, which increases commodity prices.
Core CPI's monthly percentage change is graphed below.
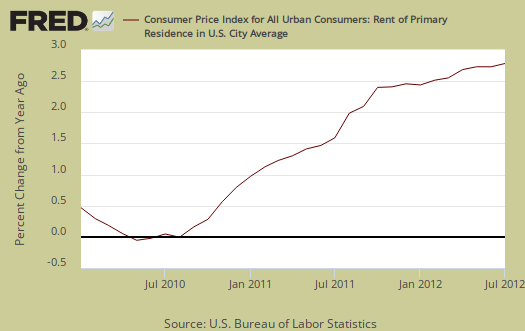
Shelter increased 0.1% and is up 2.1% for the year. Rent increased 0.3% and the cost of renting has increased 2.8% for the last 12 months. Hotels & Motels declined -2.3% for the month. Used cars & trucks declined -0.5% and smoking, tobacco, increased a whopping 1.1% in a month. Airfares declined -2.7% and I guess that flood of auto insurance ads on your TV, driving you to buy a DVR or go insane, mounts up, motor insurance costs increased 0.4% for July.
Graphed below is the percentage change from a year ago of rent, the largest monthly household expense for people who can least afford increases as those with less money disproportionately rent vs. own.
Food and beverages overall increased 0.1% for July and are up 2.3% from a year ago. Don't expect this to last for rising prices due to the drought are already at the grocery. The food at home index (think groceries) had no change for July, hard to believe, and is up 1.9% for the year. Fresh Fruits & veggies declined -0.3%, while meats increased 0.3%. Dairy declined -0.5%.
Eating out, or food away from home increased 0.2% from last month and is up 2.9% from a year ago. This changes are the same as last month's.

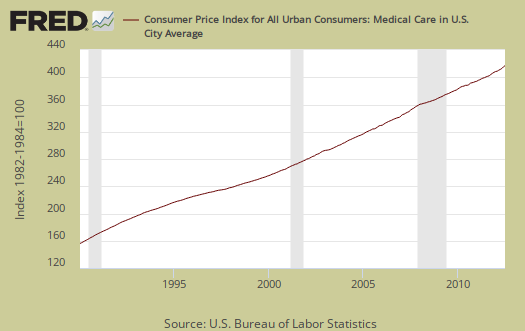
The Medical care index increased 0.4% and has increased 4.1% over the last 12 months. This is the largest increase since May 2008. Hospital services and physicians increased 0.4%. Medical commodities are things like your prescription drugs and increased 0.5%. Below is a bar graph of the Medical index. Nowhere else do we see a ridiculous, constant to the point the graph forms a triangle, increase in costs like the below.
According to the BLS, for the year, food and beverages, which includes food at home, made up 15.2% of the index. Housing is 40.9% and transportation, including gas for the car, is 17.2% and all energy is 10%. Medical care is only 7.1%, they claim. All items minus food and energy are considered 75.8% of the total price expenditures for consumers.
The DOL/BLS does take yearly surveys on where the money goes in the monthly budget, but as one can see, food and energy are significant amounts of the monthly finances. Run away costs in these two areas can break the bank, so can food. Additionally CPI uses substitution, so if steak goes through the roof, somehow we're all just fine with hamburger and prices didn't really overall increase much. If we see food inflation flat over the next year, we know something is wrong with the measurement as the drought is projected to dramatically increase food prices.
CPI-W for the month, unadjusted was 225.568, a 1.3% increase for the year, and declined -0.2% for the month, although not seasonally adjusted. CPI-W is used to calculate government transfer payments, such as social security increases.
Last month's CPI report overview, unrevised, although most graphs are updated, is here.
If you're wondering why the graphs look weird, the graph calculates percentages from the index and doesn't round. The actual data from the BLS report does round to one decimal place. In other words, 0.05% is rounded to 0.1%.
COLA won't be determined until end of Q3
That's at least October or Novemeber when the October numbers come out. It's Q3 to Q3 a year ago.
The COLA adjustment was 3.6% for 2012.