
The Federal Reserve's Industrial Production & Capacity Utilization report, G.17, shows zero change in industrial production for January 2012. The culprit was utilities and the Fed blames the weather. Warming temperatures in winter cause home energy production to drop beyond their typical output levels. The big fat industrial production zero hides some very promising changes. Manufacturing alone increased 0.7%. December's industrial production was revised upward 1.0%. This report is also known as output for factories and mines.

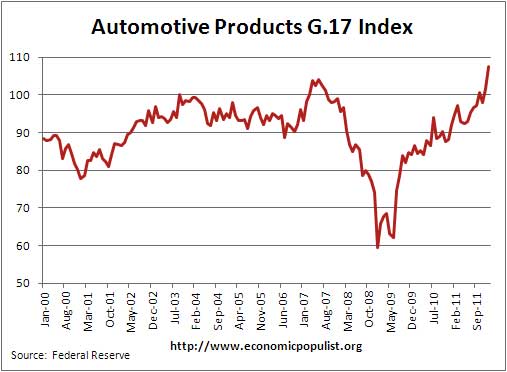
The reason manufacturing output increased 0.7% is a blow out jump of 6.8% in autos & parts, with vehicles alone increasing 10.4% in a month. Vehicles are up 27.9% from January 2011. Without autos and parts, manufacturing increased 0.3%. Below is a graph of the Federal Reserve's industrial production index for just automotive products, seasonally adjusted. What we see is a recovery of the automotive industry in the United States.
The January industrial production flat line is due to utilities, which showed a -2.5% change and mines, which also declined, -1.8%.
While total industrial production has increased 3.4% from January 2011, the index is still down 4.1% from 2007 levels. Here are the major industry groups yearly industrial production percentage changes from a year ago.
- Manufacturing: +4.5%
- Mining: +5.8%
- Utilities: -7.5%
Below is the Fed's description of Market groups from the report and their monthly percent changes.
The production of consumer goods edged down 0.1 percent in January. The index for consumer durables increased 3.8 percent, but the index for consumer nondurables declined 1.2 percent. Among durables, the production of automotive products climbed 5.8 percent, and gains were also recorded for home electronics; appliances, furniture, and carpeting; and miscellaneous goods. Among consumer nondurables, the output of non-energy goods decreased 0.1 percent, as a decline in foods and tobacco offset gains in clothing, chemical products, and paper products. The output of consumer energy products fell 4.0 percent, with substantial decreases for both residential utilities and fuels.
The production of business equipment moved up 1.8 percent in January with appreciable increases in all of its major component indexes: Transit equipment advanced 2.5 percent, information processing equipment increased 1.8 percent, and industrial and other equipment gained 1.5 percent. The output of business equipment has risen in each of the past 9 months and in January stood nearly 11 percent above its level 12 months earlier.
The production of defense and space equipment increased 0.8 percent in January following a decline of 0.6 percent in December.
Among nonindustrial supplies, the output of construction supplies fell 0.4 percent in January following a gain of 3.0 percent in December. In January, the output of construction supplies was 5.3 percent above its level of a year earlier but remained well below its pre-recession peak. The production of business supplies increased 0.5 percent in January.
The production of materials moved down 0.4 percent in January after having risen 1.0 percent in December. A decrease of 1.7 percent for energy materials, which primarily reflected lower output by utilities and reductions in oil and natural gas extraction, more than accounted for the decline in overall materials. The index for durable materials advanced 0.8 percent because of increases in the production of consumer parts and equipment parts; the index for other durable materials decreased 0.3 percent. The production of nondurable materials edged up 0.1 percent; the output of both textile and paper materials increased, while the production of chemical materials declined.
Below is a graph of just the manufacturing index, part of industrial production.

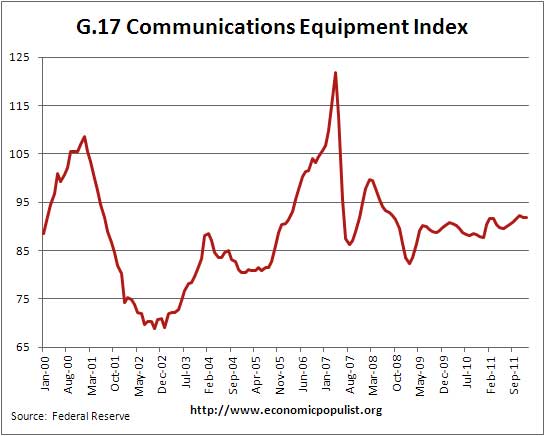
For 2011, about 3.02% of total industrial production, non-energy, is advanced technology and advanced technology manufacturing has declined by -0.4% since January 2011. Non-energy makes up 72.18% of total industrial production. Contained within advanced technology are semiconductors, electronics components. Semiconductors has declined, - 2.4% since January 2011. This is not good. Communications equipment, while up 1.7% from a year ago, contains cell phones, landlines, radio, TV, broadcast gear. It's clearly been offshore outsourced from the below graph. We know there have been major paradigm shifts in these technological areas since 2008, yet look at overall production. Telephones were offshore outsourced ages ago, set-top boxes are notorious to hire foreign guest workers and squeeze engineers and have been doing so for over a decade, so the recent drop has to be newer technologies, being offshore outsourced.
Below is another graph of industrial production since September 1990, indexed to that month. Look at the slope, the growth through the 1990's and then compare to 2000 decade. It was in 2000 when the China trade agreement kicked in and labor arbitrage of engineers, advanced R&D, I.T., STEM started in earnest.

Capacity utilization, or of raw capacity, how much is being used, for total industry is now 78.5%, a -1.8 percentage points below the average from 1972 to 2011, 80.3%. Capacity growth overall has increased 1.2 percentage points from January 2011.
Capacity utilization is how much can we make vs. how much are we currently using, of what capacity is available now. Capacity utilization is industrial production divided by raw capacity. The U.S. is still not producing what it is capable of, a reflection of the output gap.

According to the report, manufacturing uses 76.91% of capacity, utilities 10.55% and mining 12.54%.
Below is the Manufacturing capacity utilization graph, normalized to 2007 raw capacity levels, going back to the 1990's. Too often the focus is on the monthly percent change, so it's important to compare capacity utilization to pre-recession levels and also when the economy was more humming.

Capacity, on the other hand, is the overall level of plants, production facilities, and ability to make stuff, that we currently have in the United States. Think about a new factory being built, or a factory shut down and it's machinery sold at auction and shipped to China. This is capacity.
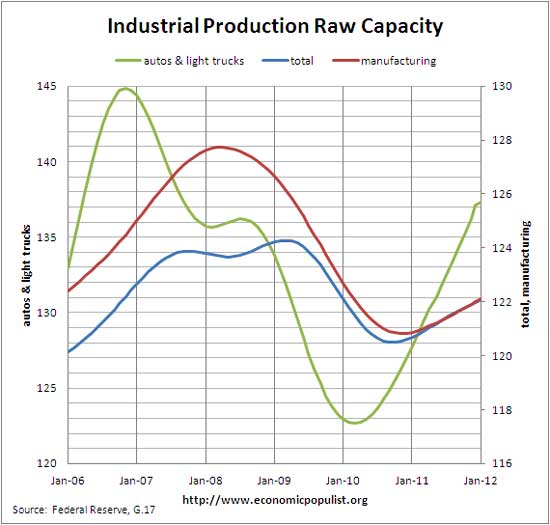
Below is the graph of raw capacity to total industrial production, just manufacturing and finally zeroing in on autos & light trucks. This is just how much capacity does the U.S. have to make stuff. Look at how total capacity declined, for the first time in the historical data, during the recession. This index represents the raw facilities, potential to make stuff. Notice also how flat manufacturing overall is. Then finally, notice the beyond belief come-back of autos & light truck capacity in the United States. One might look at the below, plus the above industrial production numbers and contemplate policy. Which industry was supported recently by our government? Just sayin', this ain't religion, it's numbers man and boy autos looks swell!
The Federal Reserve releases detailed tables for more data, metrics not mentioned in this overview.
If you are baffled by what crude, finished mean from the G.17 report, read these stages of production definitions.
Here is our industrial production report overview from last month, unrevised.
Recent comments