
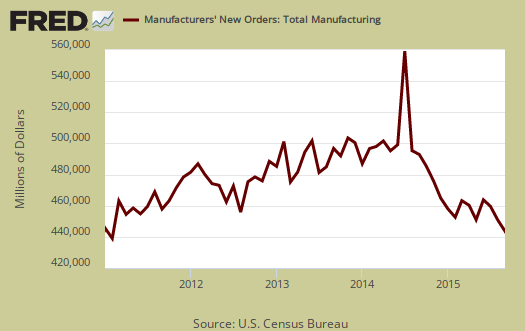
The Manufacturers' Shipments, Inventories, and Orders report shows factory new orders declined by -1.0% for September. In August, new factory orders plunged by -2.1%. Durable goods dropped by -1.2%. In August, Durable goods slid down by -2.9% Transportation new orders lead the decrease as they plunged by -3.1%. Inventories also contracted again. Generally speaking, this is another bad report implying the economy is slowing down. The Census manufacturing statistical release is called Factory Orders by the press and covers both durable and non-durable manufacturing orders, shipments and inventories.
While transportation equipment new orders plunged by -2.9% , motor vehicles bodies & parts new orders increased by 0.4%. Volatile aircraft new orders declined in nondefense by -36.0%.
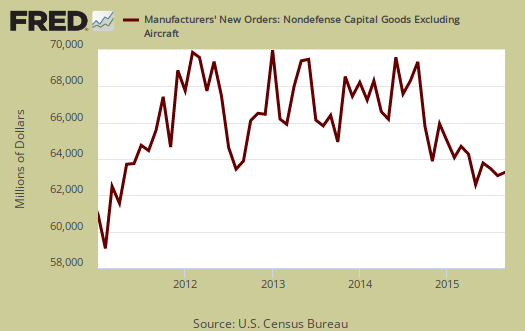
Core capital goods new orders decreased by -0.1%. The previous month showed a -1.4% decrease . Core capital goods are capital or business investment goods and excludes defense and aircraft. This is indicating slower economic growth.
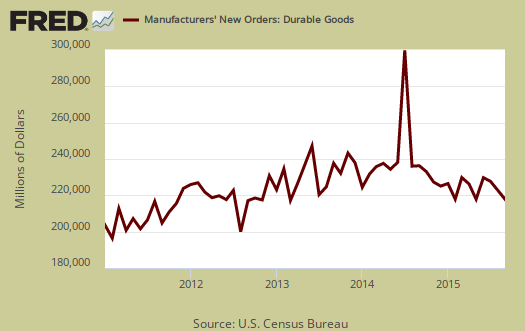
Nondurable goods decreased by -0.8%. Manufactured durable goods new orders, decreased -1.2%, as shown in the below graph.
Shipments decreased by -0.4% for the month, also not a good sign. Durable goods shipments increased by 0.1% Nondurable goods shipments decreased by -0.8% as petroleum refineries shipments plunged by -5.7%. Core capital goods shipments increased 0.5%, a bright spot in a sea of declines. Core capital goods shipments go into the GDP calculation. Below is a graph of core capital goods shipments.

Inventories for manufacturing overall contracted by -0,4%. Durable goods inventories decreased by -0.4% while nondurables decreased -0.4%. Petroleum refineries inventories plunged by -4.3% for the month and automobiles dropped by -3.1%. Inventories have contracted for all three months of the 3rd quarter.
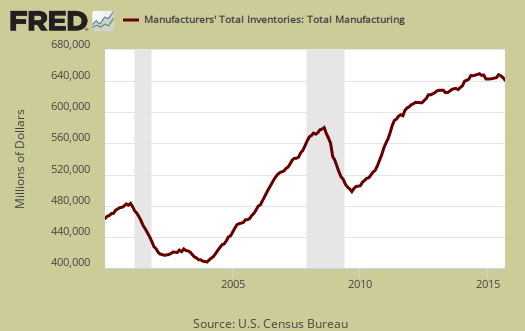
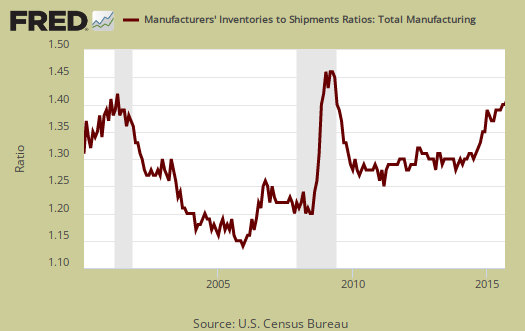
The inventory to shipments ratio was 1.35. Increasing ratios can imply economic sluggishness, but this is nothing to worry about as a ratio.
Unfilled Orders decreased -0.5%. Core capital goods unfilled orders declined by -0.3% in durable goods decreased -0.5%.
Part of this report goes into calculating GDP. The BEA takes this report, called M3, and uses the shipments values to calculate investment in private equipment, investment in software. Manufacturing inventories also goes into the changes in private inventories GDP calculation. At the bottom of this post is a little more information to estimate part of the GDP investment component.
The St. Louis Federal Reserve FRED graphing system has added individual NAICS data series from this report. If you're looking for a graph of some particular NAICS category, such as light trucks, autos & parts, or machinery, it might be found on FRED. Most news outlets source the Commerce Department, while technically correct, also makes it impossible for you, our beloved detailed reader, to find the actual statistical report and data which you might be focused in on. There is much more detail in the statistical tables published by the Census website for manufacturing statistics.
Deep Dew Dew
Check the Chicago Fed CFNAI-MA3 index. Note the August and September readings on the bar graph. Both months show all 4 components (depicted by different colors) below zero. Now check all preceding months and note the only time this has occurred was during a recession. The next reading will be on November 23, it will replace a strong July reading in the 3 month average. A negative reading of a similar magnitude to the past two months would still be in the range of baseline noise. Given that we should only see some weakness going forward. If however the next reading is sharply off we could be in deep dew, dew.