
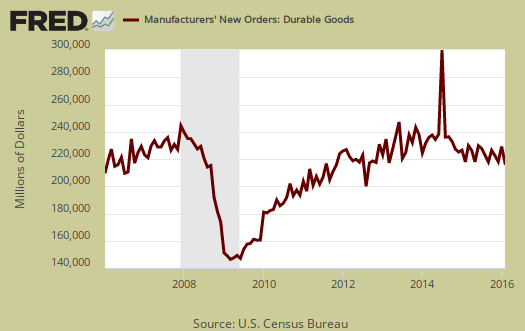
The Durable Goods, advance report shows another decline in manufactured durable goods new orders for February. New orders dropped by -2.8% and has been down three of the past for months. February shipments also were negative with a -0.9% drop. Core capital goods new orders by themselves declined by -1.8%. Without transportation new orders, which includes aircraft, durable goods new orders would have decreased by -1.0%. Defense spending just nose dived in new orders by -25.6% and without the contraction in defense, new orders would have still declined by -1.9%.
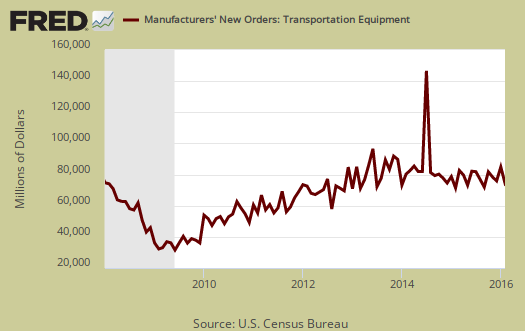
Below is a graph of all transportation equipment new orders, which plunged by -6.2% for the month and led the overall new order decline. Nondefense aircraft & parts new orders dropped by -27.1%. Aircraft & parts from the defense sector decreased by -29.2%. Aircraft orders are notoriously volatile. Motor vehicles and parts increased by 1.2%.
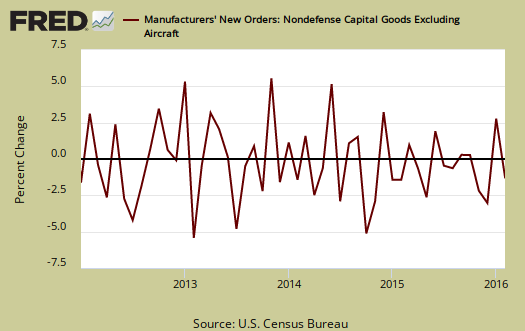
Core capital goods new orders decreased by -1.8%. January's core capital goods new orders increased by 3.1%. Core capital goods is an investment gauge for the bet the private sector is placing on America's future economic growth and excludes aircraft & parts and defense capital goods. Capital goods are things like machinery for factories, measurement equipment, truck fleets, computers and so on. Capital goods are the investment types of products one needs to run a business. and often big ticket items. A decline in new orders indicates businesses are not reinvesting in themselves. Machinery new orders dropped by -2.6%, computers & electronics new orders dropped by -0.9% as communications equipment dropped by -2.3%. Primary metals new orders declined very slightly by -0.1% while fabricated metals products dropped by -1.2%.

To put the monthly percentage change in perspective, below is the graph of core capital goods new orders, monthly percentage change going back to 2012. Looks like noise, even during the great recession, which tells us the monthly percentage changes in this report really need to be taken with a grain of salt and one should think quarterly. Yet this month is particularly smelly and thus might very well be a warning sign of bad economic events to come.
Shipments also declined by -0.9% after a January 1.5% increase. New orders are not necessarily shipped the next month an order is made. Below are graph the monthly durable goods shipments. Shipments are part of GDP.

Shipments in core capital goods decreased -1.1% after a January -1.3% decline. The below graph goes back to 2000 to show how core capital goods shipments tracks recessions, the gray bars in the graph.

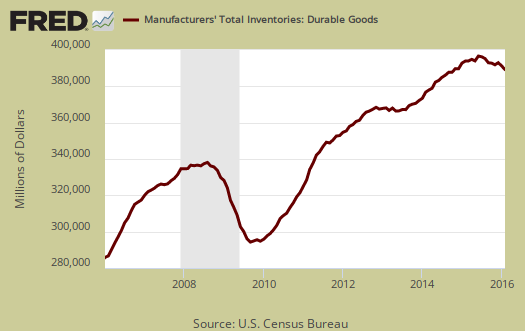
Inventories, which also contributes to GDP, decreased -0.3% after a January -0.2% contraction. While changes in inventories is in real dollars and durable manufacturing inventories are only part, these figures suggest not to look to inventories to save Q1 GDP.
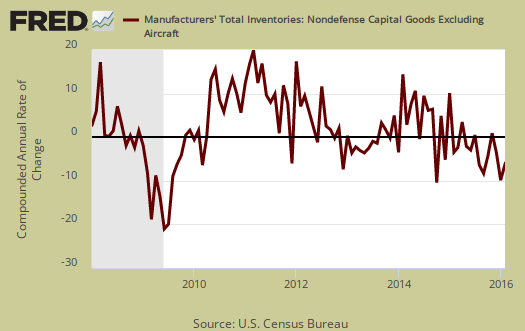
Core Capital Goods inventories decreased by -0.3% for the month. January core capital goods inventories declined by -0.6%. Graphed below are monthly core capital goods inventories annualized percentage change and pay close attention to the months of Q4, against the Q1 months.
Core shipments contributes to the investment component of GDP. Producer's Durable Equipment (PDE) is part of the GDP investment metric, the I in GDP or nonresidential fixed investment. It is not all, but part of the total investment categories for GDP, usually contributing about 50% to the total investment metric (except recently where inventories have been the dominant factor). Producer's Durable Equipment (PDE) is about 75%, or 3/4th of the durable goods core capital goods shipments, in real dollars, used as an approximation. Below is the national accounts description of PDE:
Nonresidential PDE consists of private business purchases on capital account of new machinery, equipment such as furniture, and vehicles (except for personal-use portions of equipment purchased for both business and personal use, which are included in PCE), dealers' margins on sales of used equipment, and net purchases of used equipment from government agencies, from persons, and from the rest of the world.
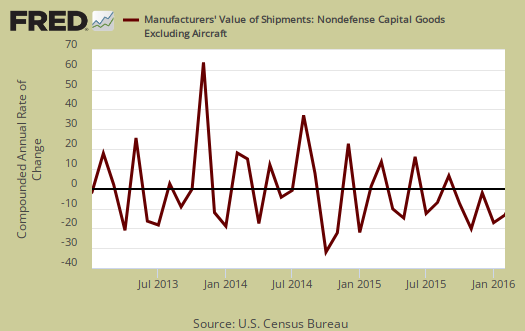
The below graph might give a feel for what kind of investment component we might see in Q1 GDP, based on PDE. Note the below is the annualized monthly percentage change of nominal values, not real, not adjusted for inflation, for core capital goods shipments.
This month's report indicates there is durable goods contraction and probably the worst aspect is this decline has been going on for the last three of four months past. With other declines or a lack of growth, it is clear manufacturing at least is back on life support.
What is a durable good? It's stuff manufactured that's supposed to last at least 3 years. Here are our durable goods, related overviews, only some graphs revised. The durable goods advance report is often revised when the full factory orders statistics are released. The report excludes semiconductor manufacturing and we must wonder if that means it is non-existent since so much has been offshore outsourced and thus corporations don't want the public to figure that fact out.
Recent comments