
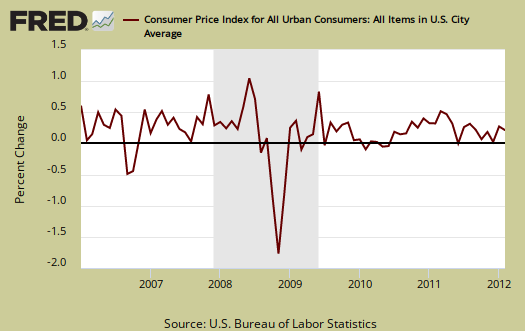
The February Consumer Price Index, which measures inflation, increased 0.4%. Gas prices are responsible for 80% of the monthly CPI increase. From a year ago, CPI has risen 2.9%. Below is the graph for CPI's monthly percentage change.
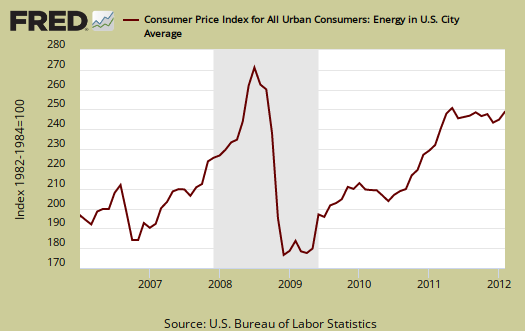
Energy overall increased 3.2% in a month. The energy index separates out all energy costs and puts them together. Energy is also mixed in with other indexes, such as heating oil for the housing index and gas for the transportation index. The energy index is up 7.0% for the year.
Gas alone increased 6.0% for February and is up 12.6% from this time last year. This is the largest percentage increase since December 2010. This index matches the below gas February 5.9% price jump, even though the actual CPI report claims gasoline increased 4.9% from January to February. The transportation index overall increased 0.3% and gas is part of this index.
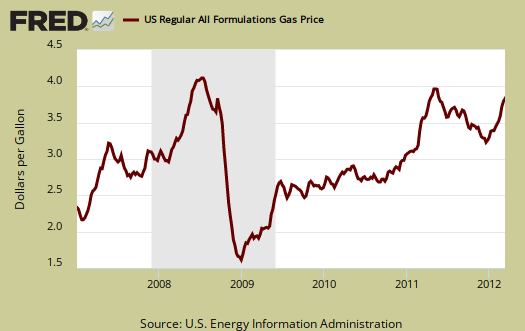
Below are gas prices, last updated March 12th. Notice the oil bubble in early 2008 and notice how close gas prices are now to that previous oil bubble. This CPI report is for February 2012 but watching gas prices can gives good indicator on future inflation to come.
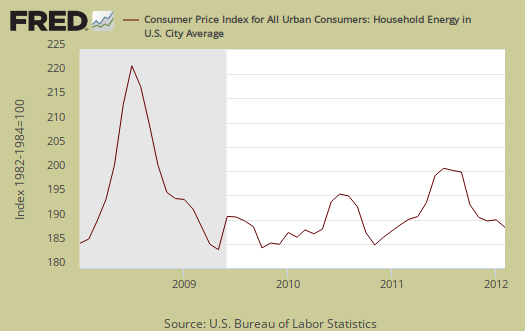
Heating your house with gas continues to get cheaper. Utility gas plummeted another -3.4%, the 5th month in a row and is down -9.8% from this time last year. Household energy overall decreased -0.6% this month, and is down -0.3% for the year. Fuel oils for households increased 2.8% and are up 8.9% for the year. Electricity costs were unchanged from January. Seems one great subsidy would be to let people retrofit their homes from heating oil to gas at this point. Below is the household energy Index.
The CPI energy index, capturing the last oil bubble below, is all energy, gas, natural gas, fuel oil and so on. Notice it's dip and return versus the food index as well as how it's not as high as the CPI energy index was during the oil commodities bubble of 2008.
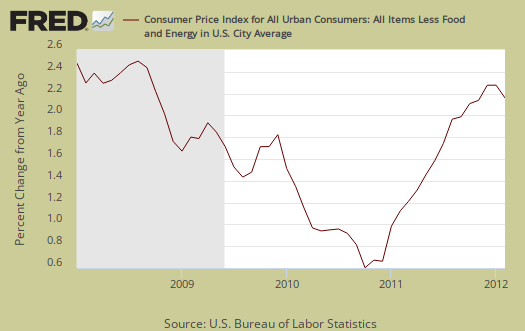
Core inflation, or CPI minus food and energy, increased 0.1% for February. Core inflation has risen 2.2% for the year. Core CPI is a Federal Reserve inflation watch number and is above the Fed's 2% yearly target rate. As we can see in the below graph of core inflation's yearly change, overall, without energy and food, inflation is past that magic Federal Reserve target number of 2% per year.
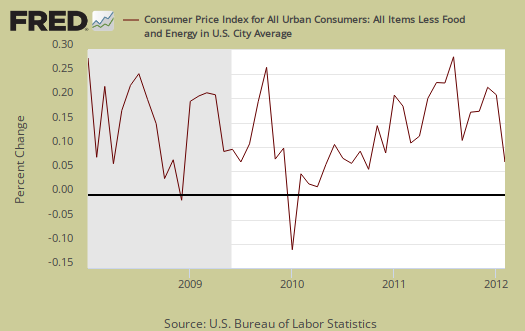
Core CPI's monthly percentage change is graphed below.
Shelter increased 0.2%, the 5th month in a row. Rent increased 0.2%, home owner's equivalent rent increased 0.1% and hotels, motels, temporary housing jumped 1.9% in February. New vehicles increased 0.6%, while used cars & trucks dropped another -0.2% from last month. This is the 6th month in a row buying a used auto has become cheaper.
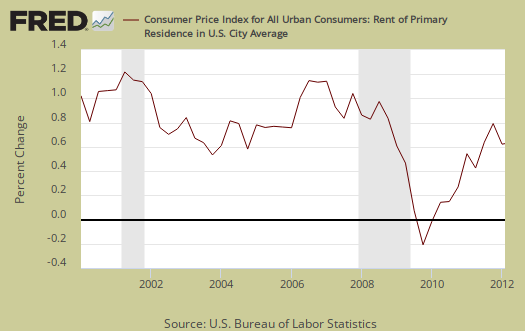
Graphed below is the quarterly percentage change of rent, the largest monthly household expense for people who can least afford increases as those with less money disproportionately rent vs. own.
Food and beverages overall increased, 0.1%. The food at home index (think groceries), while unchanged from last month, the 2nd month in a row and is up 4.5% for the year. For the year, meats are up 5.8%, fats and oils (really?) have increased 10.8%. This month, fruits & veggies dropped, -0.5%, dairy decreased -0.5%, and all things meat decreased -0.2%. Miscellaneous foods, the great mystery CPI statistic, increased 1.3% in a month. So, if your grocery bill doesn't match CPI, you too much be eating miscellaneous foods.
Eating out, or food away from home increased 0.1% from last month and is up 3.1% from January 2011.

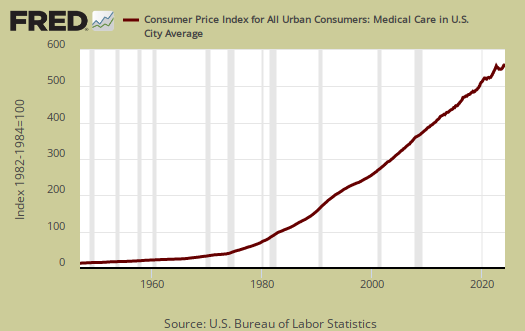
The overall Medical index increased 0.2% for the month, and is up 3.4% for the year. Medical care services had no change and is up 3.4% for the year. Professional services, or Doctors decreased, -0.2% and is up 1.4% from this time last year.
Medical commodities are things like your prescription drugs and it increased yet another 0.8% from last month and is up 3.3% for the year. Prescription drugs by themselves increased 0.6%. Advertising costs baby. Medical costs are part of core inflation.
Strange isn't it, that Medical care is never mentioned when referring to costs and inflation. It's only as important as food, yet health care is treated almost like it's an extra for daily living. The reason is the importance ranking in CPI. This is because no everyone gets a serious illness at once (but lord help you if you do), so the average medical expenses spread out of the population are diluted in overall cost of living figures.
There has been much criticism as of late that the Federal Reserve only focuses in on core CPI, instead of food and energy. According to the BLS, Food and beverages, which includes food at home, makes up 14.8% of the index. Housing is 41.5% and transportation, including gas for the car, is 17.3%. Medical care is only 6.6%, they claim. All items minus food and energy are considered 77.2% of the total price expenditures for consumers.....according to them.
The DOL/BLS does take yearly surveys on where the money goes in the monthly budget, but as one can see, food and energy are significant amounts of the monthly finances. Run away costs in these two areas can break the bank, so can food. Additionally CPI uses substitution, so if steak goes through the roof, somehow we're all just fine with hamburger and prices didn't really overall increase much.
CPI-W for the month, unadjusted was 224.317, a 3.1% increase for the year. CPI-W is up 0.5% for the month, seasonally adjusted. CPI-W is used to calculate government transfer payments, such as social security increases.
Last month's CPI report overview, unrevised, although most graphs are updated, is here.
If you're wondering why the graphs look weird, the graph calculates percentages from the index and doesn't round. The actual data from the BLS report does round to one decimal place. In other words, 0.05% is rounded to 0.1%.
Recent comments