
The New York Times wrote an overview article on the results of an economics research paper, Expenditure Cascades.
During the three decades after World War II, for example, incomes in the United States rose rapidly and at about the same rate — almost 3 percent a year — for people at all income levels. America had an economically vibrant middle class. Roads and bridges were well maintained, and impressive new infrastructure was being built. People were optimistic.
By contrast, during the last three decades the economy has grown much more slowly, and our infrastructure has fallen into grave disrepair. Most troubling, all significant income growth has been concentrated at the top of the scale.
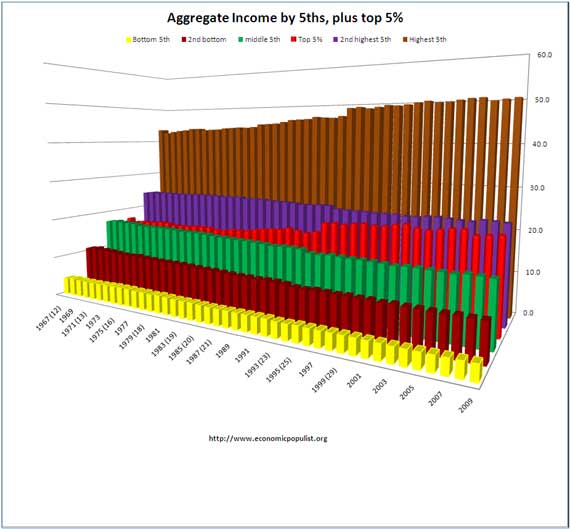
Above is a graph of aggregate income of American households, broken into 5ths. Also included, in red, is the top 5%, which are also included in the top 5th. The poorest are yellow and the highest are brown. Notice the jump in the top 5% and how the lower incomes are stagnant or declining? Notice how much of the income pie the top 5th holds, especially the top 5%, and also how their percentages of the income pie have been increasing. In other words, income inequality in the United States has dramatically increased.
Onto the Robert H. Frank, Adam Seth Levine, and Oege Dijk paper. What exactly they discover about income inequality?
First, let's figure out what the paper title, Expenditure Cascades even means. From Wikipedia:
An expenditure cascade occurs when the swift income growth of top earners fuels additional spending by the lower earners. The cascade begins among top earners which encourages the middle class to spend more which, in turn, encourages the lower class to spend more. Ultimately, these expenditure cascades reduce the amount that each family saves, as there is less money available to save due to extra spending.
The super rich force an overall price increase, say home prices, because they can afford to pay absurd sums with their increased wealth. In other words, the uber-rich cause everything to increase in price, so the middle class and poor are forced to spend more, save less. Good examples of this are the California Bay Area and New York City. Then there is positional externality. To keep up with the Joneses, Billy Bob doesn't save, his usual amount, instead spends more money on a house payment, for a bigger house, thinking he must have a bigger house to keep up with his social class. He saves less, instead buying a McMansion, all to keep up the appearance of social status. The uber-rich increase the cost of maintaining that class status, cause they are going through the stratosphere, everything costs more.

What the authors found was the above explains the greater falling savings rate of Americans than traditional (read Milton Friedman) income and savings models predict.
Our expenditure cascade hypothesis is that a pervasive pattern of growing income inequality in the United States has led to the observed decline in savings rates.
Another startling statistic from the paper is 20% of Americans have zero or negative net worth. The paper also discovered, but with a lot of as well as piece of the pie, that income inequality increases anxiety, a lack of wellness in a society.
The GINI coefficient is a measure of income inequality and zero means everybody is identical and 100 means one dude has all of the money.
Did you know the United States has now slipped to 7th in wealth and ranks well below on the GINI coefficient scale to othe industrialized nations? Below is the GINI ratios for Households from 1999 to 2009.
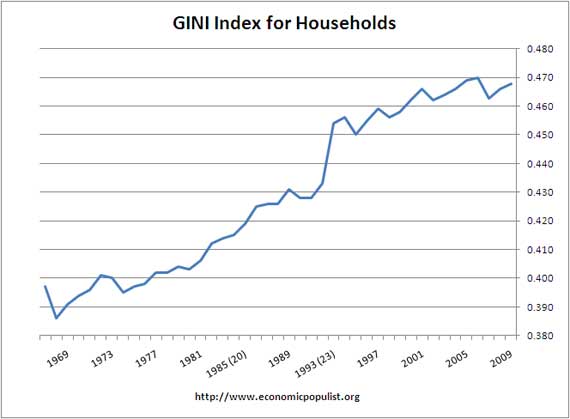
The United States in comparison to the rest of the world has a GINI index of 46.8 in 2009. Looking at the CIA GINI ranking (out of date), that puts the U.S. on the same level as Rwanda.
What the authors found was a 1% increase in the GINI index was correlated with a 8.73% increase in personal bankruptcies.
For our sample of the 100 most populous counties, the Gini coefficients increased by an average of 4.41 percent between 1990 and 2000.
Our estimate thus implies that increased inequality in these counties was associated with an almost 40 percent increase in bankruptcy filings between 1990 and 2000. This estimate seems reasonable given that, on average, non-business bankruptcies increased 148 percent in our sample.
Gets better. A 1% increase in the GINI index correlates to a 1.21% increase in divorce.
Given that the average change in the Gini coefficient between 1990 and 2000 was 4.41 percent for counties in our sample, the estimate implies that increased inequality was associated with a 5.34 percent increase in the number of divorces during this period.
Gets even better. Remember all of those people buying houses 3 hours away because that's all they could afford in the early part of the decade. It appears income inequality also affects commute times.
Increased inequality is on average associated with an increase of 0.0073 in the proportion of adults with commutes longer than one hour.
Did you know an increase in total hours worked usually implies higher income inequality? Think workin' 3 jobs to make ends meet and you get the idea.
Also, the most expensive homes are also an indicator of nearby income inequality.
Yes, that's us, we're in a stratified society. Think Victorian Era and the Robber Barons. To make matters worse, there is a correlation between income inequality and increased spending among the lower classes.
From statistical analysis of U.S. Census data for the 50 states and 100 most populous counties, we find evidence that rapid income growth concentrated among top earners in recent decades has stimulated a cascade of additional expenditure by those with lower earnings.
I don't know about the validity of their mathematical models in terms of people's behavior, for one, I'm not sure if they normalized to interest rates for savings data.
Regardless, these results are not absolute, the results are showing just the ratios cause an increase in divorce, personal malaise, bankruptcies and living your life stuck in traffic on the highway.
Pretty damning if you ask me and of course, what bean counter puts sitting in traffic, bankruptcies or divorce on their macro economics GDP/GNP/productivity spreadsheet?
Interesting how the good ole days start with the FDR administration. Notice how the bad new days start with the Reagan administration. Just sayin'.
Comments
Good Stuff...
Fascinating how these 'economic collapses' occur in conjunction with income stratification. And no, Robert, the current crop of economists are not interested in any sort of reality. It's all about models. And the models they use are still based on 19th, yes 19th Century math, continuous functions describing the inevitability of market equilibrium my ass!
We are about to go through a revolution in recognized economic thought. At least we'd better, keeping to the status quo does not bear thinking about. Listening to some soon to retire Dem politician on NPR this morning speak about 'the economy' was a chilling experience as this guy was rattling on using the same broken logic to 'explain' what had happened to our 'free markets'; even the moderator wasn't buying it.
Only question is how many will starve before our 'leaders' start getting and acting on economic advice based on reality instead of what Geithner or MSNBC think reality is. The entire policy structure of our government's economic 'planning' is built on theory that is not only obsolete but...
...totally wrong.
'When you see a rattlesnake poised to strike, you do not wait until he has struck to crush him.'
I wouldn't say that on models
These guys use an "oscillating wave" for income distribution. While I "get" their mathematics, I didn't review it because I really am unsure of that model. That said, these are the including behavioral economics, specifically the social class pressures which cause people to spend, basically beyond their means. More I'm thinking of the many other variables involved which could give spurious results...
but bottom line, they are refuting classic economics, specifically the static idea that if you have more income, disposable income, of course you will save more.
Regardless, I don't think it's too much of a stretch to say that when income inequality increases and you squeeze people to the point of financial ruin, bankruptcies increase and divorces increase. But the stats were global on the GINI coefficients.
Check out their paper, the graphs on income inequality and the rate of the increases, those graphs alone are worth the look.
One cause
Income inequality is driven by the Federal Reserve.
In a fiat currency world, money is created out of thin air at the whims of central bankers. Money creation is decoupled from value production. Wealth no longer has to do with value, it's about which piglets have a suckling position at the teats of the Fed.
Eliminate the morally criminal cabal of private bankers that have carte blanch control to create the public currency, reimpose the gold standard, and the creation of wealth and the creation of value will fuse back together.
Right now money is created out of thin air by central bankers and given to their buddies. And that is the entirety of the inequality.
Gold and other precious
Gold and other precious metals are one of the ways to store wealth but they are not good to use for a monetary system. For the following reasons: They wear away over time in minuscule amounts that are not recoverable, thus disappearing overtime. They are heavy to carry in anything but small amounts. They are risky to carry. Most importantly there is a finite amount of them making it impossible to expand the money supply to allow for the growth of jobs and business. The argument against fiat money is that it causes inflation. That is true when the supply is corrupted or manipulated unethically as in the counterfeiting of Continentals during the Revolutionary war, or during the Weimar Republic in the 1920s in Germany, and many other examples. However, Lincoln successfully funded the civil war using fiat money (the Greenback dollar), and there wasn't an inflation problem. He had the choice of doing that or borrowing from the banks at the offered rate of 30% interest. Other governments have successfully used fiat money without the inflation problem - i.e. the Islands of Guernsey printed their own money to fund the building of a market place in the early 1800s. When the marketplace was completed they put a small tax in place, and all the money they had created was recovered over time via the tax, and then they burned it to remove it from circulation. One of the problems today is we have given the power to create money to the private federal reserve banks, and also the power to control that money supply. When the gov't needs money they go to the Treasury and the Treasury borrows it from the privately owned Fed Reserve banks. The banks make a credit entry into their books thus creating money which is made (out of nothing - i.e. a simple ledger entry) available to the Treasury. The government in turn hands the Fed bank treasury bonds in the amount of the borrowed money. The bonds carry an interest burden, meaning that the buyer must be paid interest on the money he gives to buy the bond, and when the bond matures he gets his money back, but in the meantime has earned interest on them, which is the incentive to purchase the bond. Bonds are sold at public auction to private buyers such as pension funds, individuals and foreign countries (originally the interest on the bonds that weren't sold went to the Fed banks, but in the 1970s congressman Wright Patman implemented legislation forcing the banks to return that money to the US Gov't - currently the bonds that aren't sold can be considered as a reserve against which the bank can loan money - at interest, of course). The bonds that are sold carry an interest burden, which the taxpayer pays. This is the primary problem - we are borrowing money with an interest burden. We don't need to do this. We can create the money without the interest burden and without the involvement of the Fed. As long as only enough money is created for goods and services then inflation won't be a problem. If it starts to rear it's head, we can increase taxation and the incoming tax money will go against the credit on the books, which makes that money go out of existence. Not only would this do away with the national debt, but income taxes would go way down, as their would be no interest on debt to pay.
iPads & graphs
FYI
The third column overlaps the graphs in the second on the iPad.
ipad, graphs
Thanks for letting me know. These graphs are larger than normal, but the site is fluid, so if you expand the browser everything should scale, but I'll make a point to check out the ipad display dimensions or look to scaling the graphs for posts in future.
"...social class pressures
"...social class pressures which cause people to spend, basically beyond their means ..."
I have often heard this "keeping up with the Joneses" explanation of people being drawn into excessive spending, but I don't think I have ever seen that clearly demonstrated. I would be interested to see research addressing this.
Surely, Mr. $48,000 probably tries to fit in with Mr. $72,000s lifestyle if they have contact with each other, and lately many have been willing to go into debt to get their kids through college and thus cope with a tighter job market. But I know this overreaching isn't a continuous distribution -- it has fairly sharply demarcated break points where some of these choices are not possible, by any degree of debt or scrambling.
At some of those break points, people don't even try to keep up with the Joneses, but instead they get down with the Snopeses.
A mild example of this "amble to the bottom" has been the boom in second-hand and thrift shops in the last 20 years. When I was in college in the 70s, pawn shops and charity stores were for poor people, and middle class folks stayed away. Now, they're only a step below Wal-Mart, and people of the lower 4 quintiles shop there as readily as anywhere else. (I was an early adopter in this regard.)
And then there are food banks. In the 70s there were no such things. Now they are everywhere, and a high percentage of their clients are working.
Not pride and pretense, but mostly rational coping strategies, have driven Americans into debt.
Noni
behavioral economics
I didn't go through their math in this post, but I noticed they used theta to represent people and their income ratios. They reference a series of papers on this positional externality, i.e. social class, "herd" behavior to keep up with the Jones.
I was looking at it thinking interest rates. For a long time regular savings doesn't really pay because there is little interest, so why would people save?
Then, I'm seeing people are plain broke and having to use MC/Visa to eat, make rent, not exactly buying two boats.
The McMansion thing though we sure did see this in the last decade, millions signing up for homes they could not afford.
Anyway, I'm not that up on my "behavioral" and have a tendency to like very concrete numbers I'm assured are true cause/effect...
but the stats they provided are real.
500% increase at the very top
David Kay Johnson analyzed people making $50 million or more and in one year, from 2008 to 2009, the increase in salaries, wages was 500%.
His article is here.
This seems to make sense
I didn't bother to read the paper, so forgive me if this is addressed therein.
That makes a great deal of sense, actually. Incomes tend to be distributed exponentially, meaning that income distributions within the top 5% are about as unequal as incomes are in the whole population. So, if you have a lot of people leave the group making $50 M because everyone's income goes down, you'd see exactly this. Say you have these 3 people: A makes $51M, B makes 54M, and C makes $70M. The average is $58M. Everyone loses 10% of their income, so A makes $46M (drops out), B makes $49M (drops out) and C makes $63M. C is the only one left, so the "average" goes up from $58M to $68M, or up by 17%. This statistic you cite doesn't really tell you what you think it does. This is why people use quintiles, not firm cut-offs like $50M, to calculate these things.
quintiles, here is another blog post
You're right, Quintiles scale. On the other hand, if one takes even the top 1%, it doesn't capture these off the stratosphere numbers. Also, maybe in America it's exponential but try running that in say Sweden or Finland. ;)
I dug into it more this post.
The problem with quintiles is one needs to get below 1% to really see the uber-rich and what's going on. It's similar to CEO pay, some of it is so exponential, instead of quintiles, ya almost have to look at the percentage changes per corporation, per title.
I mean this never ending "1%" includes a lot of regular people because the "uber rich" club is so exclusive it's comes down to the hundreds out of 155M (or whatever it is currently) income earners.
Therefore I think Johnston's peek into these top 74 is valuable.
Presidents
This is probably missing the conversation, but Reason.com linked to this page in an article written Feb. 3 by Josh Brokaw.
I found the discussion of this paper by Robert Frank, one of the authors, fascinating in the 11/15/10 episode of EconTalk, but I think it's interesting that at the end of the episode, he seemed very excited that his prescription for policy changes had received the blessings of Milton Friedman. I'm not convinced Mr. Frank himself is a "populist" exactly, despite the nature of his findings.
In any case, I'm not sure I see your point about he presidential changes. It seems the upturn in GINI index started in 1969, early enough in the Nixon administration that it could be a result of Johnson's policies, and 1980 doesn't seem to show any change in slope or character of the index. The biggest variation in the character of the index in the period shown seems to be in 1993 or 1994, in the Clinton administration. It seems strange to me that such a large, one-time event might appear so late in the Reagan/Bush administrations and not be a result of actions by Clinton.
didn't go that deep
but income inequality has been documented to start with the Reagan policies and Clinton, well, one has NAFTA in 1993 but no, I didn't correlate exactly to which policy had what effect. Carter also enacted some policies that could contribute to income inequality but at least for myself, I did not match up, exactly, 'tax cut x' is directly responsible for GINI coefficient increase y. if someone did, I'd love to read that research!
You add some good commentary, I hope you get an account, where all of your comments are tracked so we can more easily follow the discussion.