
Whoop-de-do! I have no idea why some of the financial press headlines buzz industrial production has incredible gains. The Federal Reserve is publishing a 0.1% increase from last month. That ain't no blow out. Here is the detailed report.
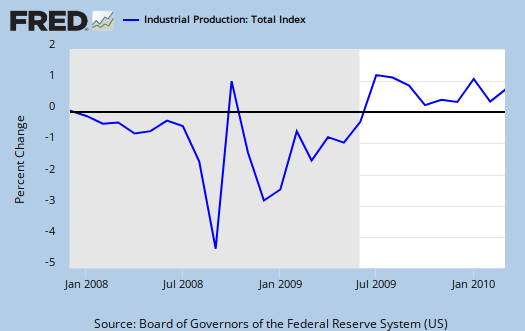
Industrial production edged up 0.1 percent in March and increased at an annual rate of 7.8 percent in the first quarter. Manufacturing output rose 0.9 percent in March, led by widespread gains among durable goods industries. Factory production was likely held down in February by the winter storms but nonetheless rose at an annual rate of 6.6 percent for the first quarter as a whole. The output of mines increased 2.3 percent in March. Utilities output dropped 6.4 percent; after a relatively cold February, demand for heating fell in March as temperatures climbed to above-normal levels. At 101.6 percent of its 2002 average, industrial output in March was 4.0 percent above its year-earlier level. Capacity utilization for total industry advanced 0.2 percentage point to 73.2 percent, a rate 7.4 percentage points below its average from 1972 to 2009, but 3.7 percentage points above the rate from a year earlier.

For industrial production the marketing group major changes are:
- Final Products: +0.3%
- Consumer goods: -0.2%
- Business equipment: +1.4%
- Nonindustrial supplies: +0.3%
- Construction: +2.3%
By Industry:
- Manufacturing: +0.9%
- Mining: +2.3%
- Utilities: -6.4%
The big news is February's numbers were revised, from 0.1% to 0.3%. But, as noted in last month's look see on industrial production. In the monthly release, note this:
Production of consumer energy products contracted 3.7%
Uh, we're we supposed to revamp the economy with all of these new green job industries?
Then we have this:
The gain in mining production mainly reflected increases in oil and gas well drilling, in stone, sand, and gravel quarrying, and in coal mining. The output of utilities fell 6.4 percent. Capacity utilization for utilities dropped 5.5 percentage points to 78.6 percent, a rate 8.0 percentage points below its average for the period from 1972 to 2009.
Utilities are what you think they are, the electric and gas companies and so on. So, after one freezing nasty month, February, it's not surprising to see a major drop in energy use.
Here's some good news, especially on durable goods:
The index for durable goods advanced 1.4 percent in March and rose 10.5 percent at an annual rate in the first quarter, the third consecutive quarterly increase. In March, all major categories of durables strengthened, and most categories posted gains of more than 1.0 percent. Expansions of 2.0 percent or more were recorded for computer and electronic products, for motor vehicles and parts, and for furniture and related products.
While the production increases are a great sign, it's all relative. Below is a graph of industrial production on a longer time period scale. As one can see it's still way below the December 2007 (start of this recession) level and still at 2003 values.


Capacity Utilization is somewhat flat again, but one must account for the dramatic utilities change. Utilities dropped 5.5% in capacity utilization for the month. Manufacturing capacity utilization only rose 0.6%. The breakdown is:
- Manufacturing: 70%
- Mining: 90.2%
- Utilities: 78.6%

The below graphs show the overall decline of U.S. capacity utilization. These graphs show the U.S. is simply not producing what it is capable of, a reflection of the output gap.

Below is the Manufacturing capacity utilization graph. While we see a consistent improvement, obviously it is no where near pre-recession levels.

Subject Meta:
Forum Categories:
| Attachment | Size |
|---|---|
| 247.3 KB |
Recent comments