
The Federal Reserve's Industrial Production & Capacity Utilization report, G.17, shows a decrease of -1.2% in industrial production for August 2012 and Hurricane Isaac is blamed for 0.3% of that decrease. This report is also known as output for factories and mines. Manufacturing declined -0.7%, mining -1.8% and utilities a whopping -3.6%. Oil and gas Gulf of Mexico rig shutdowns are blamed for the -1.8% drop in the output of mines.
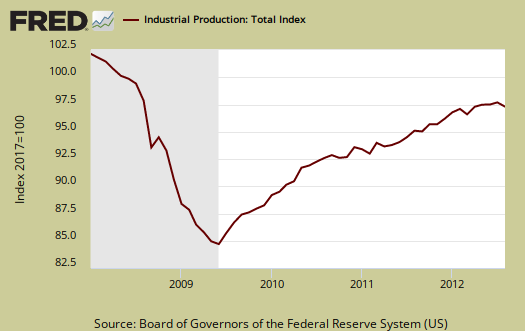
Total industrial production has increased 2.8% from August 2011 and is still down -3.2% from 2007 levels, that's right, five years. Here are the major industry groups yearly industrial production percentage changes from a year ago. Utilities is fairly surprising, considering the drought and heat domes of this year, although there was also an unusually warm winter.
- Manufacturing: +3.8%
- Mining: +3.0%
- Utilities: -4.7%
Below is the Fed's description of Market groups from the report and their monthly percent changes. The report also gives annualized rates and bear in mind these are much higher than monthly percentage changes by their nature. Autos products dropped -4.7% and is part of durable goods.
The production of consumer goods decreased 1.2 percent in August after having increased 0.4 percent in July. The output of durable consumer goods dropped 2.9 percent in August, while the output of consumer nondurables decreased 0.7 percent. Among durable consumer goods categories, the production of automotive products fell 4.7 percent; all of the other major categories posted smaller declines. Within nondurables, the production of non-energy goods moved down 0.2 percent. Clothing, chemical products, and paper products all contributed to the decrease, while the output of foods and tobacco was unchanged. The index for consumer energy products dropped 2.1 percent, a decrease driven by a fall in residential electricity sales.
The output of business equipment moved down 0.2 percent in August but was 11.4 percent above its year-earlier level. After having increased for seven consecutive months, the production of transit equipment declined 0.4 percent in August as a result of a decrease in motor vehicle assemblies. The output of information processing equipment moved down 0.3 percent, while the index for industrial and other equipment was unchanged.
The output of defense and space equipment moved up 0.5 percent in August; production had jumped 1.9 percent in July, as workers returned from a labor strike at a major military aircraft manufacturing facility. The level of the index in August was 3.8 percent above its year-earlier level.
Among nonindustrial supplies, the output of construction supplies edged down 0.1 percent in August, a fourth consecutive monthly decline. In addition, a decrease of 1.3 percent in the production of business supplies reversed the cumulative gain in the index over the previous four months.
The output of materials to be processed further in the industrial sector decreased 1.5 percent in August, with losses in all of its major components. The output of durable materials fell 1.1 percent. A drop of 3.4 percent in the index for consumer parts followed a jump of 4.4 percent in July; the largest contributors to this swing were categories related to motor vehicles. The output of equipment parts moved down 1.3 percent in August, a second consecutive large monthly decline. The production of nondurable materials decreased 0.3 percent. The indexes for textile materials and for chemical materials declined, while the production of paper materials moved up. The index for energy materials fell 2.7 percent, driven by decreases in oil and natural gas extraction.
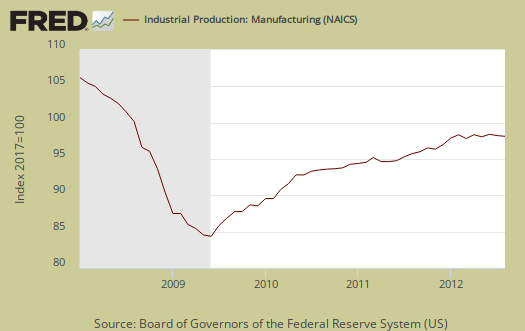
Below is a graph of just the manufacturing portion of industrial production.
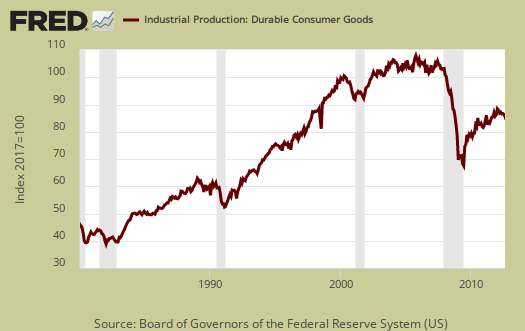
Durable consumer goods industrial production declines also seem to follow recessionary periods. Below is the graph since 1980, so August's decline of -2.9% is not welcome news.
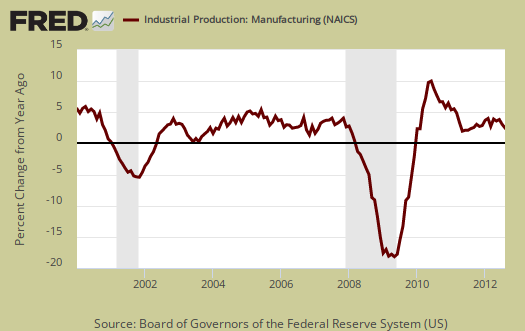
Below is another graph of industrial production showing the percent change from a year ago. Here too we see declining percentage slopes aligning to recessionary periods, the gray bars in the graph.
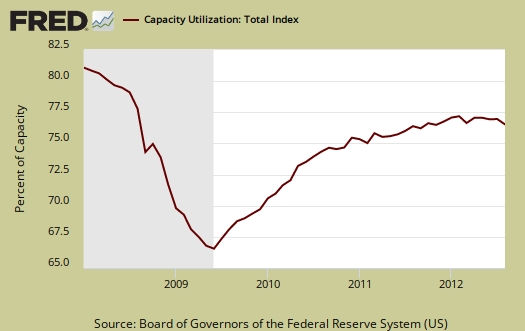
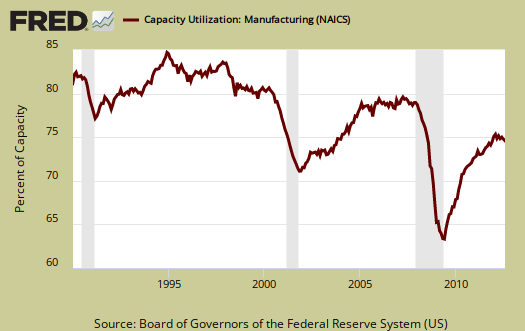
Capacity utilization, or of raw capacity, how much is being used, for total industry is 78.2%, now 2.1 percentage points below the average from 1972 to 2011, 80.3%. Capacity utilization has increased 1.2 percentage points from August 2011. Manufacturing capacity utilization has increased 1.8 percentage points from a year ago to 77.0%. Utility capacity utilization has drop, -5.3 percentage points from a year ago to 73.3%. Mining has increased 0.9 percentage points, to a 88.6% utilization rate from August 2011.
Capacity utilization is how much can we make vs. how much are we currently using, of what capacity is available now. Capacity utilization is industrial production divided by raw capacity.
Capacity growth is raw capacity and not to be confused what what is being utilized. Instead, this is the actual growth or potential to produce. Capacity is the overall level of plants, production facilities, and ability to make stuff, that we currently have in the United States. Think about a new factory being built, or a factory shut down and it's machinery sold at auction and shipped to China. This is capacity. Capacity growth overall has increased only 1.4 percentage points from August 2011. Below is the capacity growth increase from a year ago of the subcategories which make up industrial production.
- Manufacturing: +1.3%
- Mining: +2.0%
- Utilities: +2.3%
According to the report for 2011, manufacturing uses 77.0% of capacity, with durables and nondurables each about 51.6% of that. Utilities use 10.3% and mining 12.8% in 2011 (rounded) to give a ratio of manufacturing vs. mining and utilities in terms of capacity. Selected high tech industries holds a measly 3.45% of the industrial portion and with computers only 0.44% and communications equipment only 0.66%.
Below is the Manufacturing capacity utilization graph, normalized to 2007 raw capacity levels, going back to the 1990's. Too often the focus is on the monthly percent change, so it's important to compare capacity utilization to pre-recession levels and also when the economy was more humming.
The Federal Reserve releases detailed tables for more data, metrics not mentioned in this overview.
If you are baffled by what crude, finished mean from the G.17 report, read these stages of production definitions. Stages of production have implications for exports and imports. Finishing industrial production implies goods for final sale and thus what kind of output one will see for the month.
Here is our overview from last month, only graphs revised.
Recent comments