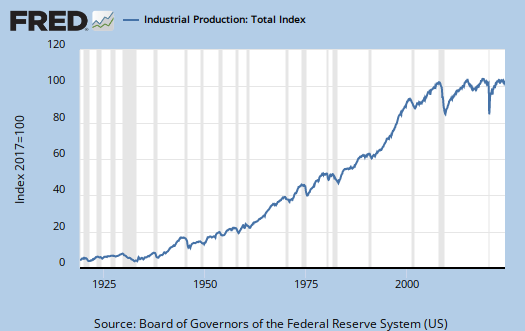
Last month's Industrial production and capacity utilization data was spun to some glorious V for victory recovery, at which point I noted a contraction is a contraction, which is what last months data was.
I've been looking over industrial production and capacity utilization for July 2009, trying to analyze a trend. July's industrial production index rose to 96.0.
Here is last months graph, not including this months number, zeroing in on this depression recession.

Src: St. Louis Federal Reserve
So, while we see the cliff diving stop, we are down in the bottom of the trough, looking at one steep hill to climb.

Src: Federal Reserve
For fresher, here is the Federal Reserve's Press release:
Industrial production increased 0.5 percent in July. Aside from a hurricane-related rebound in October 2008, the gain in July marked the first monthly increase since December 2007.
Manufacturing output advanced 1.0 percent in July; most of the increase was due to a jump in motor vehicle assemblies from an annual rate of 4.1 million units in June to 5.9 million units in July.
Excluding motor vehicles and parts, manufacturing production edged up 0.2 percent. The output of utilities fell 2.4 percent, reflecting unseasonably mild temperatures in July, and the output of mines increased 0.8 percent. At 96.0 percent of its 2002 average, total industrial production was 13.1 percent below its level of a year earlier. In July, the capacity utilization rate for total industry edged up to 68.5 percent, a level 12.4 percentage points below its 1972-2008 average.
Look at this whopping 17.4% increase in autos, which increased durable goods to 7.4%.
The production of consumer goods rose 0.6 percent in July, as an increase of 7.4 percent in consumer durables more than offset a decrease of 0.9 percent in nondurable consumer goods. The output of consumer durables was boosted by a 17.4 percent increase in the production of automotive products.
Today also saw the New York Fed's Manufacturing Empire Survey for NY:
The general business conditions index increased 13 points, to 12.1, its highest level since November of 2007

Src: New York Fed
The inventories index remained well below zero, the new orders and shipments indexes rose to their highest levels in many months.
Econ Browser also notes that industrial production is clearly a real positive economic indicator. Calculated Risk notes capacity utilization is still way down, so do not expect any investment to happen anytime soon.
EconomPic has two graphs on capacity utilization and notes how depressed it is, even with the beyond belief 17.5% jump in autos due to the cash for clunkers incentives.
Here is the graph of sectors broken down. While it's small, minuscule, you can see the heart beat of manufacturing. Like a heart attack victim, we now have a faint pulse. Now if only we could get a real manufacturing policy to raise such a critical economic sector from the dead.

Src: Federal Reserve

Military and War products
Material and products that are purchased by the military and the government for war purposes, are mixed in the GDP, and I believe, in the industrial production figures.
What kind of wealth is built with military ordnance? And does that really reflect a positive element of recovery?
well
it creates products and jobs as well as international sales. Of course the destruction these products cause is never calculated in but that's if they are actually used, or more explicitly how they are used.