
The Federal Reserve Industrial Production & Capacity Utilization report shows industrial production soared 0.8% in December after a November -0.7% decline. The reason for the December increase was utilities. Utilities jumped up by 6.6% on colder weather in December and very warm weather in November. Manufacturing production by itself increased 0.2% and mining was unchanged. The bigger news is industrial production has declined by -0.6% for the forth quarter. For the year, industrial production increased by 0.5%. The G.17 industrial production statistical release is also known as output for factories and mines.

Total industrial production has only moved the needle by 0.5% from what it was a year ago, as mining imploded on oil and gas and manufacturing has barely budged. December industrial production was 4.6 percentage points above the 2012 average. Industrial production is still way below the very long term 1972-2015 average by -4.5 percentage points. Below is graph of overall industrial production's percent change from a year ago. Industrial production is a recession indicator and follows the grey recession bars.
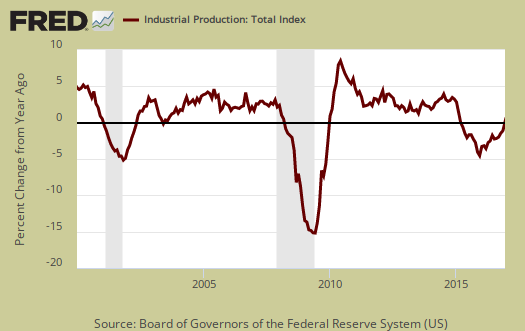
Here are the major industry groups industrial production percentage changes from a year ago. While mining looks bad, the annual change was much worse just a few months ago.
- Manufacturing: +0.2%
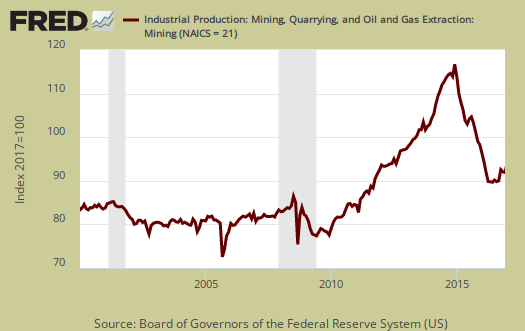
- Mining: -2.8%
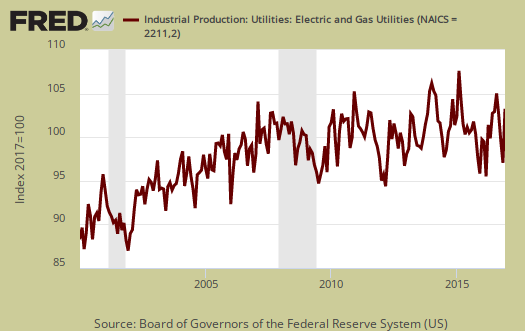
- Utilities: +6.2%
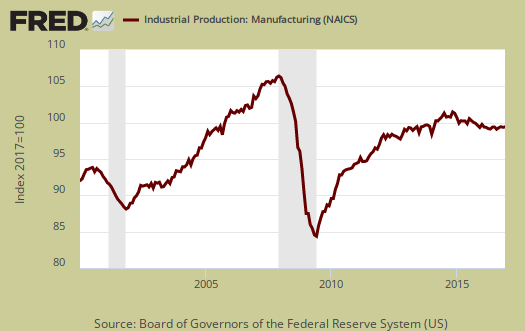
For the month manufacturing overall increased by 0.2%. November saw a -0.1% decline while October showed a 0.3% increase. Manufacturing output is 3.2 percentage points above its 2012 Levels and is shown in the below graph.
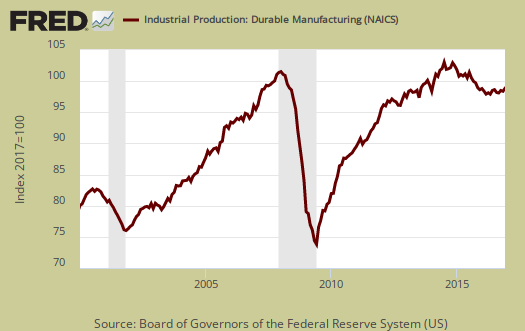
Within manufacturing, durable goods increased by 0.5%. Motor vehicles & parts increased 1.8% for the month. Primary metals increased by 1.4%.
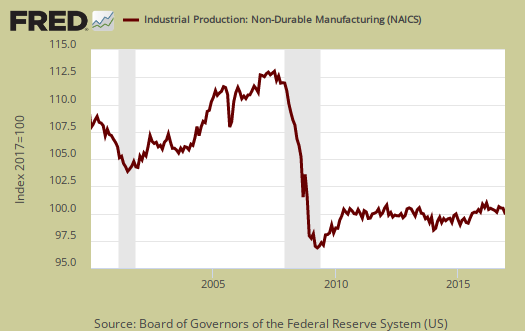
Nondurable goods manufacturing decreased by -0.3% for the month. Textile and product mills plunged by -3.0% and Chemicals declined by -1.0%.
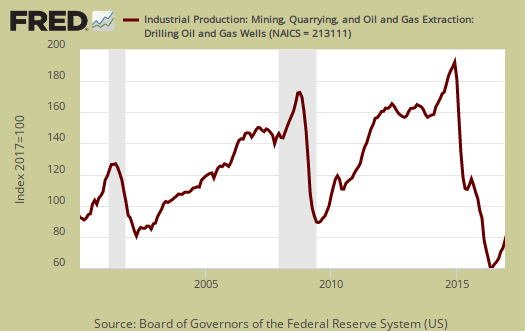
Mining had no change for the month and is now down -2.8% for the year. Oil and gas drilling's bottom has come to an end but is still down -10.5% from a year ago, but for the month increased by 9.3%. for Q4, mining increased 11.9%, annualized.
Below is oil and gas well drilling to show the incredible bust in production and what looks to be past the bottom, and a turn around.
Utilities are often volatile due to changes in weather, as shown below and as influencing this month's dramatic overall industrial production swing.
There are two reporting methodologies in the industrial production statistical release, market groups and industry groups. Market groups is output bundled together by market categories, such as business equipment or consumer goods and shown below:
In December, the jump in the output of utilities contributed substantially to gains in the indexes for consumer goods, business supplies, and materials through their energy components. Among the non-energy market groups, consumer durables posted an increase of 1.1 percent, with a gain in automotive products outweighing a decline in home electronics. The output of consumer non-energy nondurables was unchanged, as cutbacks in chemical products and paper products offset a gain in the index for foods and tobacco. An increase of 0.7 percent for business equipment was attributable to improvements both in information processing equipment and in industrial and other equipment; the index for transit equipment was unchanged. The output of defense and space equipment decreased 0.3 percent after advancing 1.5 percent in November. The indexes for construction supplies and non-energy business supplies moved down 0.3 percent and 0.4 percent, respectively, in December. The production of non-energy materials was unchanged, with a gain for durable materials offset by a loss for nondurable materials.
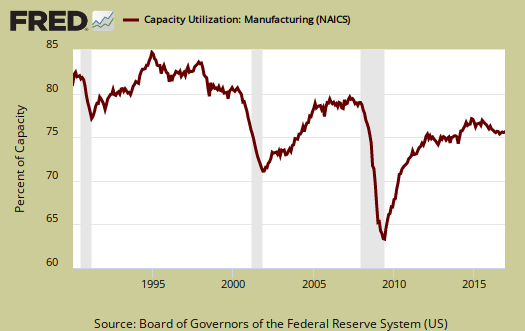
Capacity utilization, or how much raw capacity being used, for total industry is 75.5%, an increase of 0.6 percentage points from last month. . Capacity utilization has increased by just 0.1 percentage points from a year ago and is 4.6 percentage points below the long run average. This is just kind of sad and shows industry is just not humming along and the picture just doesn't change either long term. Manufacturing capacity utilization increased 0.1 percentage points for the month, is 74.8% and is 3.7 percentage points below it's long run average. Mining capacity utilization increased 0.2 percentage points to 78.1%. Mining capacity is still down by -9.2 percentage points from mining's long term average. Utilities use of it's capacity is 79.1% and is down by -6.7 percentage points from the long term average.
Capacity utilization is how much can we make vs. how much are we currently using, of what capacity is available now, or output rate. Capacity utilization is also called the operating rate. Capacity utilization is industrial production divided by raw capacity.

Capacity growth is raw capacity and not to be confused what what is being utilized. Instead, this is the actual growth or potential to produce. Capacity is the overall level of plants, production facilities, and ability to make stuff, that we currently have in the United States. Capacity growth overall has increased 0.4 percentage points from a year ago. Below is the capacity growth increase from a year ago of the subcategories which make up industrial production.
- Manufacturing: +0.8%
- Mining: -3.5%
- Utilities: +0.8%
Below is the Manufacturing capacity utilization graph and notice how the 2001-2003 time frame starts to slide as manufacturing goes offshore.
Overall while this month's report makes a great headline, yet volatility in utilities does not growth make. Manufacturing just is constantly sputtering along like a bad car engine. Mining's bottom is at least a sign of better news. Here are our previous overviews, only graphs revised. The Federal Reserve releases detailed tables for more data, metrics not mentioned in this overview.
Recent comments