
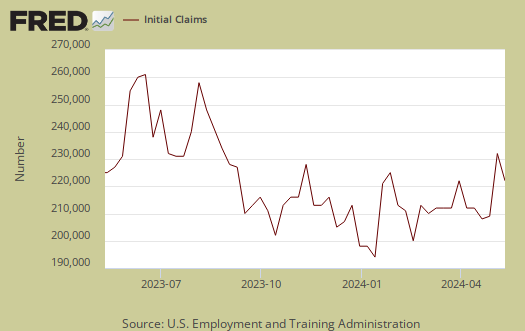
The DOL reported people filing for initial unemployment insurance benefits in the week ending on September 28th, 2013 was 308,000, a 1,000 increase from the previous week of 307,000. Since the monthly unemployment report will not be released due to the shutdown, we show below the correlation of initial unemployment claims to payroll growth.
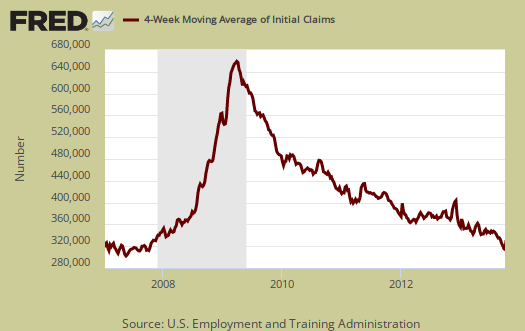
The more important statistic of initial unemployment insurance claims is the four week moving average on those filing for benefits. The four week moving average decreased 3,750 to 305,000. In the below graph we see the four week moving average is now at pre-recession 2007 levels. If anyone recalls, even before the Great Recession the job market was not so hot, yet this is finally, a positive sign, going on five years and ten months. The four week moving average is graphed below from January, 2007.
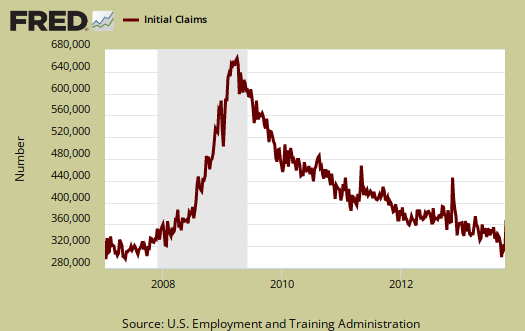
Below is the mathematical log of initial weekly unemployment claims. A log helps remove some statistical noise, it's kind of an averaging and gives a better sense of a pattern. As we can see, we have a step rise during the height of the recession, but then a leveling, then a very slow decline, or fat tail. That fat tail has taken over six years to return to early recession levels, so the time it has taken to drop might still be a concern. There are a lot of people out there who are not counted in labor force statistics who need a job.
Initial unemployment claims and BLS unemployment and payrolls are three completely different labor statistics. Initial claims statistics do not go into the unemployment report calculations and one cannot add, subtract off the number of people receiving unemployment benefits and get any meaningful metric. One can however find correlations between the three and thus give meaning to initial claims on jobs and the unemployment situation.
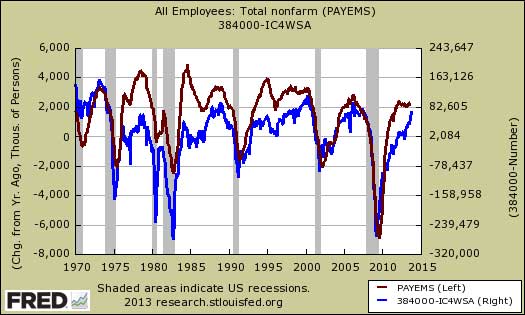
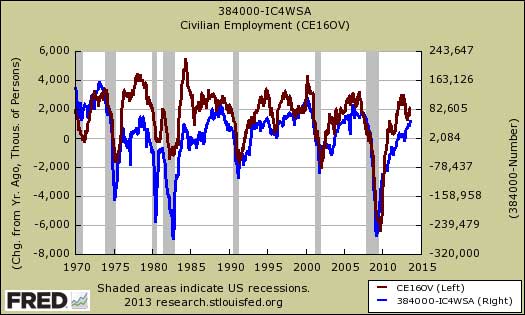
Below is a graph of the change in payrolls from a year ago, in red, against the monthly moving average in initial claims, re-averaged monthly, in blue. The initial claims average is centered around 384,000 claims made weekly, so the graph shows initial claims as positive when they are below 384,000 and negative when they are above that figure. As we can see, we get zero growth in payrolls from a year ago when initial claims exceeds around 384,000 per week as an average and some payrolls growth when initial claims drops below 380,000 per week on average.
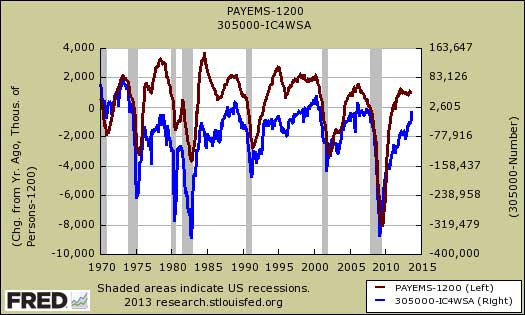
The United States needs at minimum about 100,000 jobs each month, or 1.2 million per year to just keep up with population growth in the potential workforce. The below graph recenters payrolls around 1.2 million growth from a year ago, in red. Payrolls above zero in the below line mean from a year ago job growth has kept up with population growth in the workforce. Payrolls below zero in the below graph show the United States has not created 1.2 million jobs in the past year to employ the increase in workers. The below graph recenters the initial claims monthly average to 305,000 per week. If the number in the below graph is less than 305,000 initial unemployment claims per week on average the number if positive. What we see is a loose correlation is initial claims and that initial claims really needs to drop to at least 302,000 to kick start payroll growth that is beyond maintaining the current labor force.
The correlation of people filing initial unemployment claims to the number of employed from the BLS unemployment survey is similar as shown in the below graph.
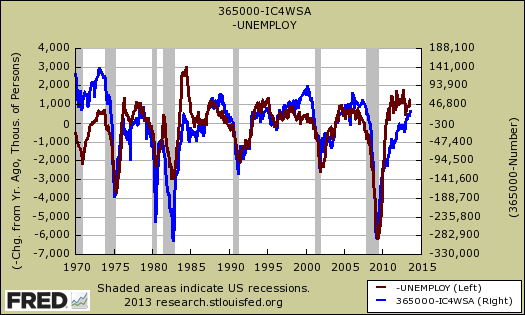
Only about 48% of workers are actually covered under unemployment insurance at all and the number of denials on claims is high and varies from state to state. Many employers do people dirty and claim they were fired with cause to justify benefit denial for as employees are fired through no fault of their own, employers unemployment insurance rates can increase. In spite of this there is a loose correlation between initial claims filings and the increase in the ranks of the unemployed as shown in the below graph. The unemployed population change from a year ago swells as initial claims goes above 365,000 on average.
The above are clearly loose correlations and more of a rule of thumb than hard figures. Still since this is all the data we have due to the shutdown, this week's initial unemployment claims also imply payroll growth at least above 100,000. Earlier we covered the ADP private payrolls report and concluded the same thing.
For the week, the DOL reports continuing unemployment claims for the previous week was unchanged by percentages and there are still large numbers of long term unemployed. The below continuing claims figure doesn't include those receiving extended and emergency unemployment benefits.
The advance seasonally adjusted insured unemployment rate was 2.3 percent for the week ending September 21, an increase of 0.1 percentage point from the prior week's unrevised rate. The advance number for seasonally adjusted insured unemployment during the week ending September 21 was 2,925,000, an increase of 104,000 from the preceding week's revised level of 2,821,000. The 4-week moving average was 2,837,250, a decrease of 4,750 from the preceding week's revised average of 2,842,000.
In the week ending on September 16th the not seasonally adjusted, the official number of people obtaining some sort of unemployment insurance benefit was 4,002,455 with 1,470,027 people receiving 2008 EUC, which was extended to January 2014. There were 11.3 million official unemployed in August. The number of unemployed has remained almost static.
As much as people wish it so, most government data is not complete and not real time. We have repeatedly warned, ad nauseum, do not bank on the initial claims number reported in the press release for that week. Initial claims for unemployment benefits is a weekly statistic and that implies a very short time window for data collection, it is always revised the next week, almost always upward. One can have unusual events which throw off the seasonal adjustment algorithm. One can have missed timing of events that can also throw a monkey wrench in one week's worth of data. As we pointed out in our weirdness in initial unemployment claims article, states might not report their quarterly adjustments for emergency unemployment benefits and we had the infamous fiscal cliff push past the final hour, which included extending those unemployment benefits for the long term unemployed last year.
Recent comments