
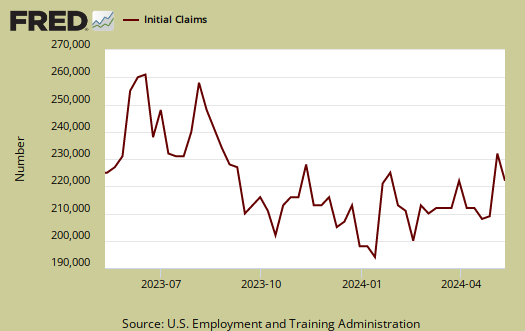
Initial weekly unemployment claims decreased to 383,000 this week. The last time initial weekly claims dropped below 400,000 was December 30th. Before you get all excited, this was the week of a record blizzard which covered a third of the nation. This is the lowest level of initial claims data since July 12, 2008.
Notice how the lack of jobs was blamed on the weather, yet now we have the lack of new filings for unemployment insurance not blamed on the weather? Really? People could get to the unemployment office that was open in a blizzard yet businesses could not report mythical created jobs during an entire month which contained a blizzard?
From the jobless claims report:
In the week ending Feb. 5, the advance figure for seasonally adjusted initial claims was 383,000, a decrease of 36,000 from the previous week's revised figure of 419,000. The 4-week moving average was 415,500, a decrease of 16,000 from the previous week's revised average of 431,500.
Initial unemployment claims are seasonally adjusted, although record blizzards are not your basic seasonal amounts. Bottom line, this is another data point where one must want to see a pattern.
The 4 week average, now at 415,500, and does not include the December outliner data point of a 388,000.
Below is the mathematical log of initial weekly unemployment claims, so one can get a better sense of the rise and fall of the numbers. A log helps remove some statistical noise, it's kind of an averaging. As we can see we have a step rise during the height of the recession, but then a leveling, not a similar decline. We have this yo-yo bobblehead, over 400,000 every week on initial claims, never ending labor malaise.
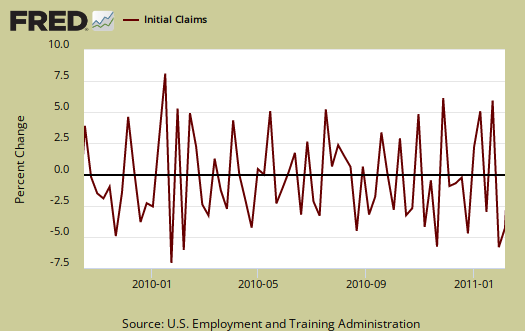
Below is a graph of the percent change in initial weekly unemployment claims for the last year. Look at how the numbers change bobs around zero, up and down, like a yo-yo.
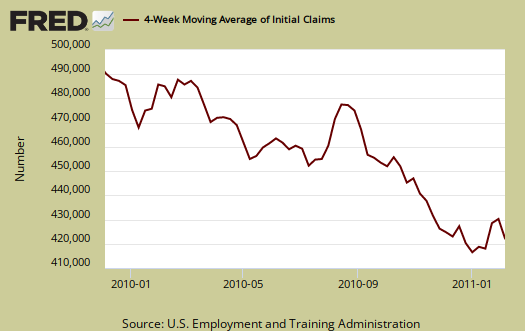
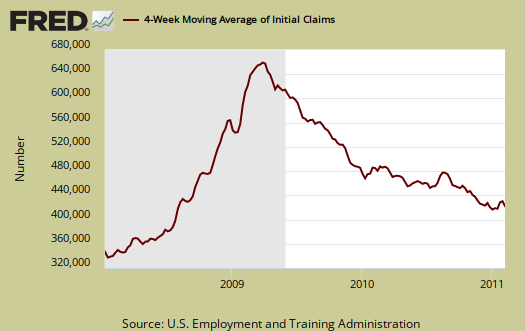
Below is the 4 week moving average, set to a logarithmic scale to remove even more statistical noise, for the last year. Here a trend that is certain would appear. It looks like we have a start, but keep your fingers crossed, wait and see. Again, we need the 4 week moving average to drop below 400,000 and keep dropping. Numerous economists say the number is 375,000 to show job growth. We see a strong decline, but then again, hasn't everyone in America been fired by now?
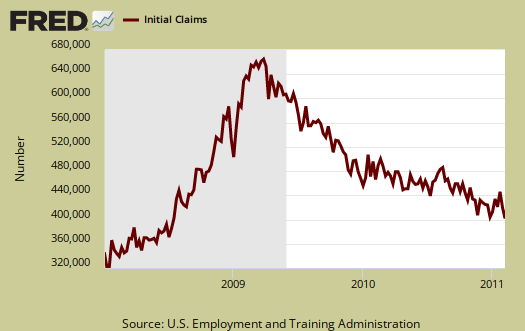
Below is a 2 year view of the 4 week moving average, set to a log scale.
In the week ending January 22nd, there were 9,405,527 official people obtaining some sort of unemployment insurance benefit.
Recent comments