
Initial weekly unemployment claims is a volatile number, subject to revisions, and has great statistical noise. The headlines buzz with a drop in initial unemployment claims. Is this really true?
From the jobless claims report:
In the week ending Oct. 2, the advance figure for seasonally adjusted initial claims was 445,000, a decrease of 11,000 from the previous week's revised figure of 456,000. The 4-week moving average was 455,750, a decrease of 3,000 from the previous week's revised average of 458,750.
That said, this is the release from the previous week:
In the week ending Sept. 25, the advance figure for seasonally adjusted initial claims was 453,000, a decrease of 16,000 from the previous week's revised figure of 469,000. The 4-week moving average was 458,000, a decrease of 6,250 from the previous week's revised average of 464,250.
As one can see, comparing the revised previous week numbers to this advance, one gets a headline buzz of an 11,000 drop. Yet comparing advance reports, without revisions, the drop is 8,000. This is just comparing two weeks of reports.
The problem is initial unemployment claims is always revised, significantly and usually upward. Hence comparing the next week's advance data, almost always results in a drop for the DOL does not have all of the raw data in. This continual drop should be attributed to revisions. The data dribbles into the DOL, from unemployment offices and state governments. The reality is initial weekly claims is not real time data. Jumping up and down for joy on this report is just a fictional warm fuzzy, you just don't have all of the numbers yet.
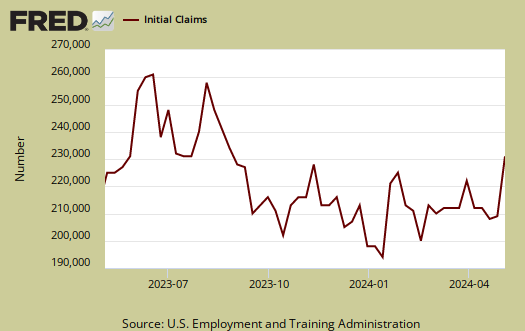
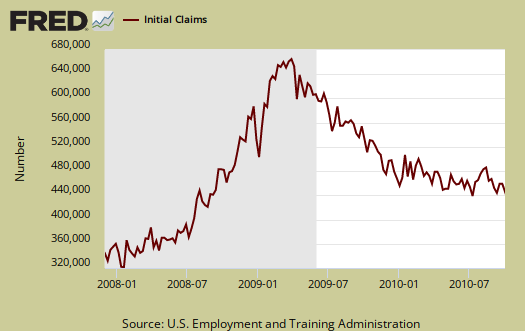
Below is the mathematical log of initial weekly unemployment claims, so one can get a better sense of the rise and fall of the numbers. A log helps remove some statistical noise, it's kind of an averaging. As we can see we have a step rise during the height of the recession, but then a leveling, not a similar decline. We have this yo-yo bobblehead, over 400,000, never ending labor malaise. This does not bode well for any sort of real recovery, which must include jobs.
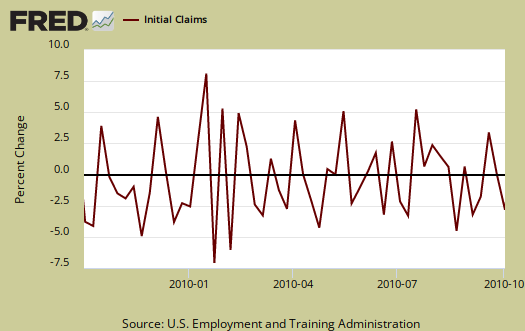
Below is a graph of the percent change in initial weekly unemployment claims for the last year. Look at how the numbers change bobs around zero, up and down, like a yo-yo. In other words, as a pattern, the numbers are simply not dropping.
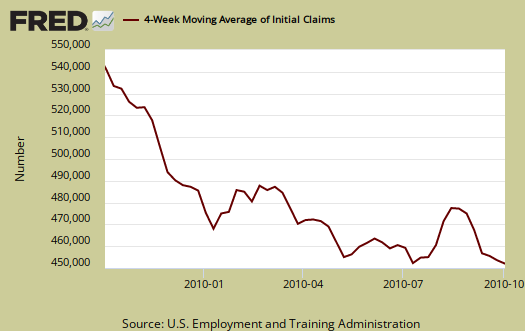
Below is the 4 week moving average, also set to logs to remove even more statistical noise, for the last year. Here too one can see this yo-yo affect around 455,000, just bobbing up and down, no steady decline! Also note the 4 week average has been lower this recession, so once again, one must take the long view on this labor economic metric.
Hidden in the data is this:
The advance number for seasonally adjusted insured unemployment during the week ending Sept. 25 was 4,462,000, a decrease of 48,000 from the preceding week's revised level of 4,510,000.
That doesn't mean people are getting jobs, it means they are falling off of the count.
We must, simply must get initial claims below 400,000. This is a national emergency, job growth and job creation.
The press does great injustice to this labor market metric by headlining just the numbers change week by week. The data comes in over time, it's not there in a week, this report will be revised. Using this metric as a warm fuzzy feel good just isn't valid. A one week report does not a trend make.
When you see that slope on the right side of the graph match the left and the absolute numbers drop below 400,000, then, let's have a party. I'll be first with champagne.
Recent comments