
Initial weekly unemployment claims is a volatile number and subject to revisions. Every week the press and traders go nuts at the latest numbers and frankly weekly reports have too much statistical noise in them to declare the job war against the American middle class over. To date initial unemployment claims have not been systematically dropping to levels which imply job creation, more like a yo-yo, hovering around 450,000. We do have two weeks of drops in initial unemployment claims, but still over 400,000. We need to wait and see if the bobble head initial claims pattern has changed, as well as the number of actual jobs created by the monthly unemployment report.
From the jobless claims report:
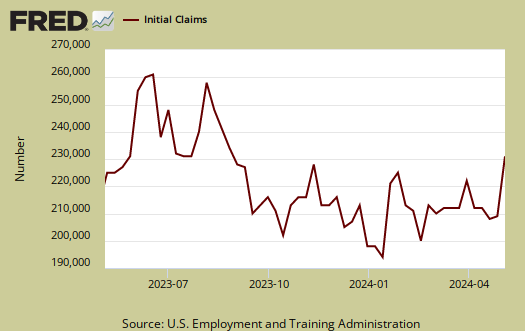
In the week ending Oct. 23, the advance figure for seasonally adjusted initial claims was 434,000, a decrease of 21,000 from the previous week's revised figure of 455,000.
That said, this is the release from the previous week:
Seasonally adjusted initial claims was 452,000, a decrease of 23,000 from the previous week's revised figure of 475,000. The 4-week moving average was 458,000, a decrease of 4,250 from the previous week's revised average of 462,250.
As one can see, last week's numbers were revised +3,000, comparing the previous week numbers to this advance, one gets a headline buzz of an 21,000 drop. Yet comparing advance reports, without revisions, the drop is 18,000. This is just comparing two weeks of reports. Also notice how last week's number's were revised upward, which is almost always the case. Don't think this is a grand conspiracy, more, the data dribbles in to the Department of Labor, not in time for the original advance report press release.
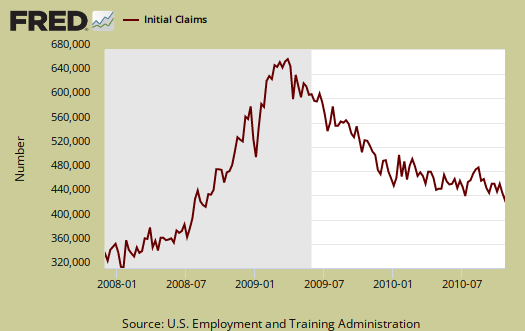
Below is the mathematical log of initial weekly unemployment claims, so one can get a better sense of the rise and fall of the numbers. A log helps remove some statistical noise, it's kind of an averaging. As we can see we have a step rise during the height of the recession, but then a leveling, not a similar decline. We have this yo-yo bobblehead, over 400,000, never ending labor malaise. This does not bode well for any sort of real recovery, which must include jobs.
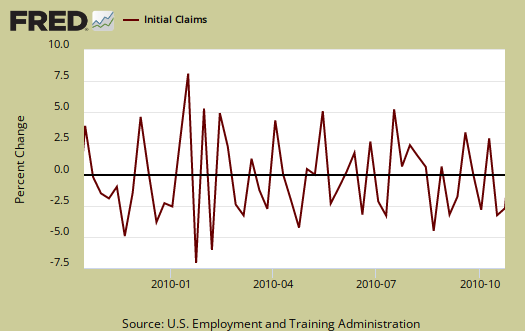
Below is a graph of the percent change in initial weekly unemployment claims for the last year. Look at how the numbers change bobs around zero, up and down, like a yo-yo. In other words, as a pattern, with this current week's report, we could actually see the start of a downward slope, or...it could a bobble-head upwards trend next week like initial claims has all year. Seriously, trader headline buzz freak out people, wait and see.
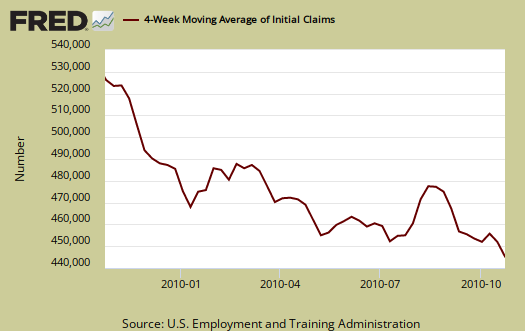
Below is the 4 week moving average, also set to logs to remove even more statistical noise, for the last year. Here too one can see this yo-yo affect above 455,000, just bobbing up and down, temporary dips, almost oscillating, without a clear, linear decline pattern. Well, there is one, but much more shallow than the press headlines suggest.
Bottom line, initial weekly claims needs to have a more steep declining slope, a larger rate of change, and needs to go below 400,000. Why it isn't at this point, is a good question. Surely everyone in America has been fired at least once by now.
Here is the drop in those covered by unemployment insurance:
The advance number for seasonally adjusted insured unemployment during the week ending Oct. 16 was 4,356,000, a decrease of 122,000 from the preceding week's revised level of 4,478,000. The 4-week moving average was 4,447,250, a decrease of 38,500 from the preceding week's revised average of 4,485,750.
There are two ways to drop from unemployment insurance, get a job, or more likely, run out of time and fall off of the benefit and count. Which one do you believe happened here?
Here is an commentary and graphs from the St. Louis Fed from last week.
Recent comments