
The December ISM Manufacturing Survey shows manufacturing is still expanding, abet at a slower pace than November. PMI dopped by -3.2 percentage points to 55.5%. New orders caused the overall decline and by themselves slid down -8.7 percentage points to go below the 60's level. Production also slid back down to moderate growth levels While this looks like a scary December, it is not, just a return to more mediocre U.S. manufacturing growth. That's always much better than a contraction of course.

This is a direct survey of manufacturers. Generally speaking indexes above 50% indicate growth and below indicate contraction. Every month ISM publishes survey responders' comments. This month two sectors blamed dropping oil prices on their sluggish performance and two more blamed the West Coast dock slow down going on by workers. One said the California rain is causing a downpour in roofing materials profits.
New orders really plunged to mediocre growth. The -8.7 percentage point drop from last month gives a level of 57.3% as shown in the below graph.

The Census reported November durable goods new orders declined by -0.7%, where factory orders, or all of manufacturing data, will be out later this month, but note the one month lag from the ISM survey. The ISM claims the Census and their survey are consistent with each other and they are right. Below is a graph of manufacturing new orders percent change from one year ago (blue, scale on right), against ISM's manufacturing new orders index (maroon, scale on left) to the last release data available for the Census manufacturing statistics. Here we do see a consistent pattern between the two and this is what the ISM says is the growth mark:
A New Orders Index above 52.3 percent, over time, is generally consistent with an increase in the Census Bureau's series on manufacturing orders.

Below is the ISM table data, reprinted, for a quick view.
| ISM Manufacturing December 2014 | ||||||
|---|---|---|---|---|---|---|
| Index | December 2014 | November 2014 | % Change. | Direction | Rate of Change | Trend Months |
| PMI™ | 55.5 | 58.7 | -3.2 | Growing | Slower | 19 |
| New Orders | 57.3 | 66.0 | -8.7 | Growing | Slower | 19 |
| Production | 58.8 | 64.4 | -5.6 | Growing | Slower | 10 |
| Employment | 56.8 | 54.9 | +1.9 | Growing | Faster | 18 |
| Supplier Deliveries | 59.3 | 56.8 | +2.5 | Slowing | Faster | 19 |
| Inventories | 45.5 | 51.5 | -6.0 | Contracting | From Growing | 1 |
| Customers' Inventories | 44.5 | 50.0 | -5.5 | Too Low | From About Right | 1 |
| Prices | 38.5 | 44.5 | -6.0 | Decreasing | Faster | 2 |
| Backlog of Orders | 52.5 | 55.0 | -2.5 | Growing | Slower | 3 |
| Exports | 52.0 | 55.0 | -3.0 | Growing | Slower | 25 |
| Imports | 55.0 | 56.0 | -1.0 | Growing | Slower | 23 |
| OVERALL ECONOMY | Growing | Slower | 67 | |||
| Manufacturing Sector | Growing | Slower | 19 | |||
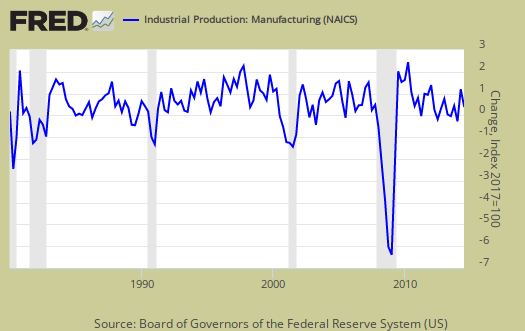
Production, which is the current we're makin' stuff now meter, of course came off the 10 year record high by plunging -5.6 percentage points to be 58.8%. Production usually follows incoming orders in the next month so we should expect production growth to slow down next month.

ISM's manufacturing production index loosely correlates to the Federal Reserve's industrial production, but not at 50% as the inflection point, instead 51.2% to indicate growth. Below is a quarterly graph of the ISM manufacturing production index (left, maroon), centered around the inflection point, quarterly average, against the Fed's manufacturing industrial production index's quarterly change (scale right, blue). We can see there is a matching pattern to the two different reports on manufacturing production.
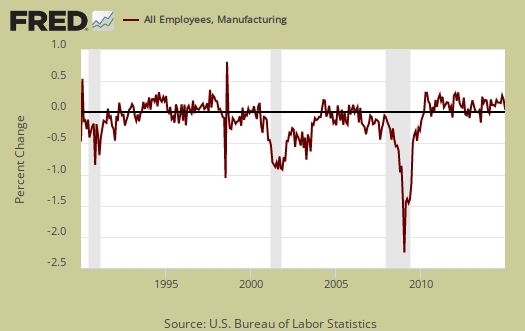
The manufacturing ISM employment index is now 56.8% and increased 1.9 percentage points from last month. This index really needs to be in the 60's to have real job creation and even though the growth accelerated it's still blasé. The neutral point for hiring vs. firing is 50.1%. Generally speaking manufacturing jobs have just been hammered going all the way back to the 1990's. Below are the BLS manufacturing non-farm payrolls (jobs) for the past decade on the left (maroon), graphed against the ISM manufacturing employment index on the right (blue). The BLS manufacturing payrolls is the monthly percentage change and the ISM manufacturing employment index is centered around it's inflection point of contraction and employment growth.
The inventories index contracted, which is somewhat bad news for economic growth. Inventories gives an estimate of how much raw materials manufacturers have on hand. They dropped -6.0 percentage points to a nasty 45.5%. Below is the relationship between BEA and ISM inventories, not the 50% inflection point one would assume.
An Inventories Index greater than 42.7 percent, over time, is generally consistent with expansion in the Bureau of Economic Analysis' (BEA) figures on overall manufacturing inventories.

Supplier deliveries are how fast manufacturers can get their supplies. A value higher than 50 indicates slower delivery times, a value below 50 means the supply chain is speeding up. The index increased by +2.5 percentage points to 59.3%, which means a slower speed. You may wonder why slow deliveries would boost up PMI and indicate stronger growth in manufacturing. The reason is slower vendor performance means there is probably higher demand for that supply and thus indicates increasing activity.

Order backlogs decreased -2.5 percentage points to 52.5%. This is fairly low growth. More order backlogs would imply a need to ramp up even more production and (hopefully) more new employees to reduce them.

Imports decreased by -1.0 percentage points to 55.0%. Imports are materials from other countries manufacturers use to make their products and high levels isn't too great for economies of scale in the U.S. We want to see U.S. manufacturers use other U.S. manufactured materials instead of imports as much as possible. Yes this figure is with the West coast dock slowdown.

New orders destined for export, or for customers outside of the United States declined by -3.0 percentage point to 52.0% and has been in expansion for 25 months. While the decline isn't very good news, at least manufacturer's exports are still growing, abet near the contraction point.

Prices really plunged and this should be no surprise to anyone watching the oil slide. Prices declined by -6.0 percentage points to 38.5%. Additionally the index has plunged by 15 percentage points over the last two months. The price index hasn't been this low since June 2012 and we should expect this to last as energy prices drive down manufacturing costs. The ISM gives an index correlation to BEA price increases of 49.7%.

Customer's inventories increased by -5.5 percentage points to 44.5%. Below 50 means customer's inventories are considered by manufacturers to be too low and this is a monthly change from about right. Customer inventories, not to be confused with manufacturer's inventories, are how much customers have on hand, and rates the level of inventories the organization's customers have.

Here is the ISM industrial sector ordered list of growth and contraction. Growth in printing is shocking as technological shifts have decimated that area.
Of the 18 manufacturing industries, 11 are reporting growth in December in the following order: Printing & Related Support Activities; Fabricated Metal Products; Primary Metals; Furniture & Related Products; Food, Beverage & Tobacco Products; Petroleum & Coal Products; Textile Mills; Paper Products; Miscellaneous Manufacturing; Electrical Equipment, Appliances & Components; and Transportation Equipment. The six industries reporting contraction in December — listed in order — are: Plastics & Rubber Products; Wood Products; Machinery; Nonmetallic Mineral Products; Chemical Products; and Computer & Electronic Products..
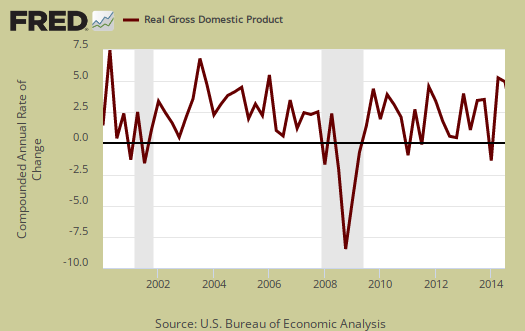
The ISM has a correlation formula to annualized real GDP, but they are now noting the past correlation, but note, PMI only has to be above 42.2% to indicate economic growth (right). Notice also that the PMI went to equal weighting in 2008. December alone gives a 4.1% annual real GDP correlation, the entire year gives a 4.2% 2014 annual real GDP correlation. The below graph plots real GDP, left scale, against PMI, right scale, real GDP up to Q3 2014. One needs to look at the pattern of the two lines to get anything out of this by quarters graph. If they match, GDP goes up, PMI goes up, would imply some correlation.
The ISM manufacturing index is important due to the economic multiplier effect. While manufacturing is about an eighth of the economy, it is of scale and spawns all sorts of additional economic growth surrounding the sector.
The ISM neutral point is 50, generally. Above is growth, below is contraction, There is some some variance in the individual indexes and their actual inflection points. For example, A manufacturing PMI above 42, over time, also indicates growth, even while manufacturing is in the dumpster. Here are past manufacturing ISM overviews, unrevised. The ISM has much more data, tables, graphs and analysis on their website. PMI™ stands for purchasing manager's index. On ISM correlations to other indexes, when in dollars they normalized to 2000 values. The above graphs do not do that, so our graphs are much more rough than what the ISM reports these indices track.
Note: The ISM is seasonally adjusting some of these indexes and not others due to the criteria for seasonal adjustment. Those indexes not seasonally adjusted are: Inventories, Customers' Inventories, Prices, Backlog of Orders, New Export Orders and Imports.
Recent comments