
The March 2013 ISM Manufacturing Survey shows PMI decreased by -2.9 percentage points to 51.3% and is in expansion for the 4th month in a row. New orders as well as production declined significantly from last month and show a slower growth manufacturing sector. March's Manufacturing survey shows inventories contracted as well.

This month's ISM report comments from manufacturing survey responders are a mixed bag with two blaming slowdowns in medical reimbursements and reduced DoD spending.
New Orders decreased -6.4 percentage points to 51.4%. New Orders inflection point, where contraction turns into expansion for the long term, isn't exactly 50%, it is 52.3% for new orders. The March decline implies demand is really slacking for manufacturing.
A New Orders Index above 52.3 percent, over time, is generally consistent with an increase in the Census Bureau's series on manufacturing orders.

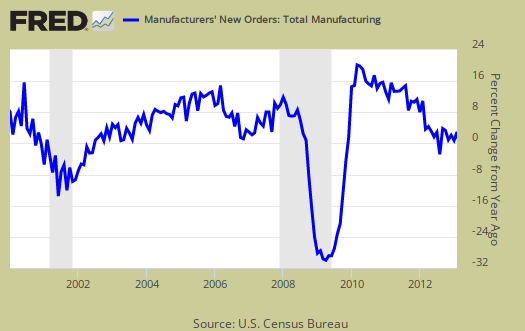
The Census reported manufactured February durable goods new orders growth was 5.7%, where factory orders, or all of manufacturing data, will be out April 2th. The ISM claims the Census and their survey are consistent with each other and February's results to match to the ISM February manufacturing new orders. Below is a graph of manufacturing new orders percent change from one year ago (blue, scale on right), against ISM's manufacturing new orders index (maroon, scale on left) to the last release data available for the Census manufacturing statistics. Here we do see a consistent pattern between the two.
Below is the ISM table data, reprinted, for a quick view.
| ISM Manufacturing March 2013 | ||||||
|---|---|---|---|---|---|---|
| Index | Feb 2013 | Mar 2013 | % Change. | Direction | Rate of Change | Trend Months |
| PMI™ | 54.2 | 51.3 | -2.9 | Growing | Slower | 4 |
| New Orders | 57.8 | 51.4 | -6.4 | Growing | Slower | 3 |
| Production | 57.6 | 52.2 | -5.4 | Growing | Slower | 7 |
| Employment | 52.6 | 54.2 | +1.6 | Growing | Faster | 42 |
| Supplier Deliveries | 51.4 | 49.4 | -2.0 | Faster | From Slowing | 1 |
| Inventories | 51.5 | 49.5 | -2.0 | Contracting | From Growing | 1 |
| Customers' Inventories | 46.5 | 47.5 | +1.0 | Too Low | Slower | 16 |
| Prices | 61.5 | 54.5 | -7.0 | Increasing | Slower | 8 |
| Backlog of Orders | 55.0 | 51.0 | -4.0 | Growing | Slower | 2 |
| Exports | 53.5 | 56.0 | +2.5 | Growing | Faster | 4 |
| Imports | 54.0 | 54.0 | 0.0 | Growing | Same | 2 |
| OVERALL ECONOMY | Growing | Slower | 46 | |||
| Manufacturing Sector | Growing | Slower | 4 | |||
Production, which is the current we're makin' stuff now meter, decreased -5.4 percentage points from last month to 51.4%, which confirms manufacturing is slowing in growth. Production usually follows incoming orders in the next month, so don't expect this month's plunge to be an anomaly.

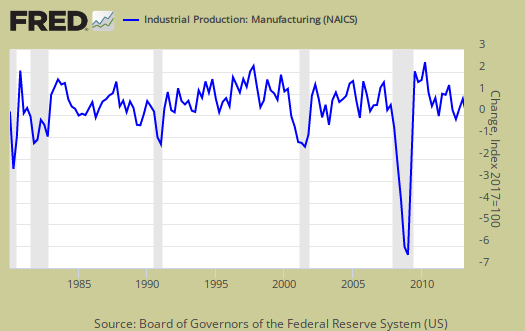
ISM's manufacturing production index loosely correlates to the Federal Reserve's industrial production, but not at 50% as the inflection point, instead 51.2% to indicate growth. Below is a graph of the ISM manufacturing production index (left, maroon), centered around the inflection point, quarterly average, against the Fed's manufacturing industrial production index's quarterly change (scale right, blue). We can see there is a matching pattern to the two different reports on manufacturing production.
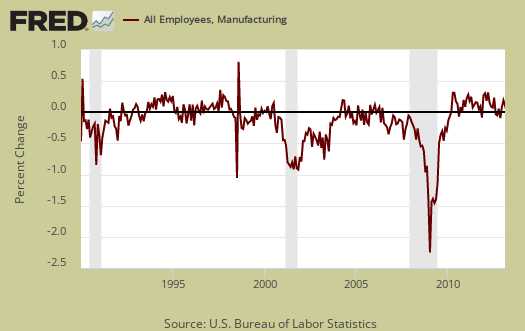
The manufacturing ISM employment index increased 1.6 percentage points to 54.2% and is still in expansion for the 42nd month in a row. The neutral point for hiring vs. firing is 50.1%. Below are the BLS manufacturing non-farm payrolls (jobs) for the past decade on the left (maroon), graphed against the ISM manufacturing employment index on the right (blue). The BLS manufacturing payrolls is the monthly percentage change and the ISM manufacturing employment index is centered around it's inflection point of contraction and employment growth. This is just monthly change, manufacturing has lost approximately 5.8 million jobs over the graphed time period.
Inventories decreased by -2.0 percentage points to 49.5%. In December 2009 inventories came in at 41.9% for comparison's sake. The ISM claims inventories are correlated to manufacturing inputs, that are part of GDP. Changes in nonfarm inventories, of which manufacturing is only a part, subtracted -1.52 percentage points to Q4 2012's 0.4% GDP.
An Inventories Index greater than 42.7 percent, over time, is generally consistent with expansion in the Bureau of Economic Analysis' (BEA) figures on overall manufacturing inventories.

Supplier deliveries are how fast manufacturers can get their supplies. A value higher than 50 indicates slower delivery times, a value below 50 means the supply chain is speeding up. The index declined, a -2.0 percentage point change to 49.4% and thus changed from slower to faster deliveries.

One of the worst bits of news from this months report is backlog of orders. They dropped by -4.0 percentage points, to 51.0%. ISM reports this is the 2nd month of growth since March 2012, yet order backlogs moved to the cusp of expansion. More order backlogs would imply production and thus hiring would be stepped up.

Imports has no change from last month's 54.0%. Imports are materials from other countries manufacturers use to make their products.

New orders destined for export, or for customers outside of the United States, increased 2.5 percentage point to 56.0% and is in expansion, the 4th month in a row.

The ISM price index decreased -7.0 percentage points to 54.5%. Prices are what manufacturers pay to make their products and this month means prices are increasing, and at a faster rate. In April 2009 the price subindex was 32%.

Customer's inventories increased a percentage point to 47.5%. Below 50 means customer's inventories are considered by manufacturers to be too low. Customer inventories, not to be confused with manufacturer's inventories, are how much customers have on hand, and rates the level of inventories the organization's customers have.

Here is the ISM industrial sector ordered list of growth and contraction. Chemical products reported contraction last month as well.
Of the 18 manufacturing industries, 14 are reporting growth in March in the following order: Wood Products; Furniture & Related Products; Plastics & Rubber Products; Electrical Equipment, Appliances & Components; Fabricated Metal Products; Paper Products; Apparel, Leather & Allied Products; Miscellaneous Manufacturing; Nonmetallic Mineral Products; Computer & Electronic Products; Transportation Equipment; Printing & Related Support Activities; Primary Metals; and Food, Beverage & Tobacco Products. The three industries reporting contraction in March are: Petroleum & Coal Products; Chemical Products; and Machinery.
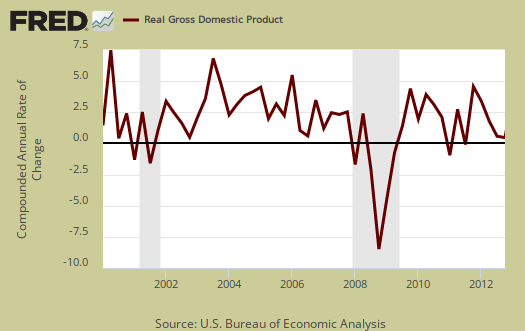
The ISM has a correlation formula to annualized real GDP, but they are now noting the past correlation. Notice also that the PMI went to equal weighting in 2008. March's data, the ISM get a 2.8% 2013 annual real GDP. The below graph plots real GDP, left scale, against PMI, right scale, GDP up to Q4 2012. One needs to look at the pattern of the two lines to get anything out of this by quarters graph. If they match, GDP goes up, PMI goes up, would imply some correlation. Of all of the ISM's correlations, this is the one which consistently is off.
The ISM neutral point is 50, generally. Above is growth, below is contraction, There is some some variance in the individual indexes and their actual inflection points. For example, A manufacturing PMI above 42, over time, also indicates growth, even while manufacturing is in the dumpster.
Here is last month's manufacturing ISM overview, unrevised. The ISM has much more data, tables, graphs and analysis on their website. For more graphs like the above, see St. Louis Federal Reserve Fred database and graphing system. PMI™ stands for purchasing manager's index. On ISM correlations to other indexes, when in dollars they normalized to 2000 values. The above graphs do not do that, so our graphs are much more rough than what the ISM reports these indices track.
Recent comments