
The July 2011 ISM Manufacturing Survey plunged 4.4 percentage points to 50.9%. New Orders contracted, the first time since June 2009.
The New Orders Index registered 49.2 percent, indicating contraction for the first time since June of 2009, when it registered 48.9 percent.

Below are New orders, which dropped -2.4 percentage points from June. This is the worst news of this report. Industries comments imply weak economic domestic demand and new orders confirms it.

Production, which is the current we're makin' stuff now meter, dropped -2.2 percentage points from last month. Production correlates to the Federal Reserve's industrial production, where the July figures will be out mid-August.

Below is the ISM table data, reprinted, for a quick view. Notice how many negative changes from last month.
| MANUFACTURING AT A GLANCE June 2011 | ||||||
|---|---|---|---|---|---|---|
|
Index |
Series Index July |
Series Index June |
Percentage Point Change |
Direction |
Rate of Change |
Trend* (Months) |
| PMI | 50.9 | 55.3 | -4.4 | Growing | Slower | 24 |
| New Orders | 49.2 | 51.6 | -2.4 | Contracting | From Growing | 1 |
| Production | 52.3 | 54.5 | -2.2 | Growing | Slower | 26 |
| Employment | 53.5 | 59.9 | -6.4 | Growing | Slower | 22 |
| Supplier Deliveries | 50.4 | 56.3 | -5.9 | Slowing | Slower | 26 |
| Inventories | 49.3 | 54.1 | -4.8 | Contracting | From Growing | 1 |
| Customers' Inventories | 44.0 | 47.0 | -3.0 | Too Low | Faster | 28 |
| Prices | 59.0 | 68.0 | -9.0 | Increasing | Slower | 25 |
| Backlog of Orders | 45.0 | 49.0 | -4.0 | Contracting | Faster | 2 |
| Exports | 54.0 | 53.5 | +0.5 | Growing | Faster | 25 |
| Imports | 53.5 | 51.0 | +2.5 | Growing | Faster | 23 |
| OVERALL ECONOMY | Growing | Slower | 26 | |||
| Manufacturing Sector | Growing | Slower | 24 | |||
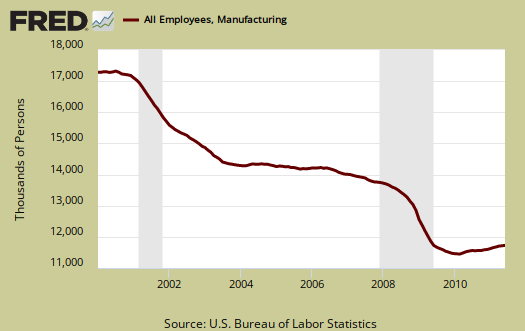
Now we come to employment. where are the damn jobs? The manufacturing ISM employment index also plunged -6.4 percentage points. According to the ISM, anything about 50.1 correlates to an increase in manufacturing employment as reported by the BLS.
Below are the BLS manufacturing non-farm payrolls (jobs) for the past decade on the left (July's numbers are not released yet), graphed against the ISM manufacturing employment index on the right. The BLS number is simply raw manufacturing jobs tally, not taking into account population growth or overall sector shrinkage as well as time lag. One can eyeball a slight correlation in the middle of the decade, yet note the divergence this recovery, starting late 2008. All indicators for this Friday's unemployment report are bleak, so possibly the ISM's tracking index is starting to reflex job reality again.
Inventories contracted, dropping -4.8 percentage points to 49.3%. Q1 2011 GDP was 69% changes in private inventories, although in Q2 GDP changes in private inventories leveled. This also is not a good directional indicator for economic growth. Manufacturing's customer inventories also decreased -3.0 percentage points to 44.0.

Exports new orders increased +0.5 percentage points to 54%. A minor bright spot in a dark and cloudy report.

Prices cliff dived -9.0 percentage points to 59.0% and is the third consecutive month prices have dropped below 80 since December 2010. According to the ISM:
In the last three months combined, the Prices Index has declined by 26.5 percentage points, dropping from 85.5 percent in April to 59 percent in July.

In terms of which industries are officially contracting, the ISM lists 7, Apparel, Leather & Allied Products; Plastics & Rubber Products; Textile Mills; Electrical Equipment, Appliances & Components; Food, Beverage & Tobacco Products; Machinery; and Chemical Products. Notice that Electrical Equipment and Appliances and really bad, Machinery are on the list this month.
They track on 18 areas and these 10 are still in growth: Paper Products; Furniture & Related Products; Computer & Electronic Products; Transportation Equipment; Wood Products; Petroleum & Coal Products; Printing & Related Support Activities; Primary Metals; Fabricated Metal Products; and Nonmetallic Mineral Products.
The ISM has a correlation formula to annualized GDP, but they are now noting the past correlation, versus current, probably due to the 0.04% Q1 and 1.3% Q2 GDP growth for 2011. While it appears their absolute levels are way off at this point, look at the drop when calculating for July:
The past relationship between the PMI and the overall economy indicates that the average PMI for January through July (57.6 percent) corresponds to a 5.3 percent increase in real gross domestic product (GDP). In addition, if the PMI for July (50.9 percent) is annualized, it corresponds to a 2.9 percent increase in real GDP annually.
The ISM neutral point is 50. Above is growth, below is contraction, although the ISM is this report is noting some variance in the individual indexes. For example, A PMI above 42, over time, also indicates growth.
Last month PMI was 55.3%. The above graphs should also have any revisions.
The ISM has much more data, tables and analysis on their website. For more graphs, see St. Louis Federal Reserve Fred database and graphing system.
Recent comments