
U.S. manufacturing expanded in December primarily due to employment and production. The December 2011 ISM Manufacturing Survey increased +1.2 percentage points to 53.9% PMI.

New Orders increased +0.9 percentage points, the 3rd month in a row for an increase, to +57.6%.
A New Orders Index above 52.1%, over time, is generally consistent with an increase in the Census Bureau's real series on manufacturing orders.

PMI is a composite index on manufacturing. Here's how the ISM defines PMI:
The PMI is a composite index based on the seasonally adjusted diffusion indexes for five of the indicators with equal weights: New Orders, Production, Employment, Supplier Deliveries and Inventories.
Below is the ISM table data, reprinted, for a quick view.
| Manufacturing at a Glance December 2011 | ||||||
|---|---|---|---|---|---|---|
| Index | December | November | % Point Chg. | Direction | Rate | Trend |
| PMI | 53.9 | 52.7 | +1.2 | Growing | Faster | 29 |
| New Orders | 57.6 | 56.7 | +0.9 | Growing | Faster | 3 |
| Production | 59.9 | 56.6 | +3.3 | Growing | Faster | 4 |
| Employment | 55.1 | 51.8 | +3.3 | Growing | Faster | 27 |
| Supplier Deliveries | 49.9 | 49.9 | 0.0 | Faster | Same | 2 |
| Inventories | 47.1 | 48.3 | -1.2 | Contracting | Faster | 3 |
| Customers' Inventories | 42.5 | 50.0 | -7.5 | Too Low | From Unchanged | 1 |
| Prices | 47.5 | 45.0 | +2.5 | Decreasing | Slower | 3 |
| Backlog of Orders | 48.0 | 45.0 | +3.0 | Contracting | Slower | 7 |
| Exports | 53.0 | 52.0 | +1.0 | Growing | Faster | 2 |
| Imports | 54.0 | 49.0 | +5.0 | Growing | From Contracting | 1 |
| OVERALL ECONOMY | Growing | Faster | 31 | |||
| Manufacturing Sector | Growing | Faster | 29 | |||
Production, which is the current we're makin' stuff now meter, jumped +3.3 percentage points from last month to 59.9%. Production loosely correlates to the Federal Reserve's industrial production, where the December statistics will be out mid-month. Yet November manufacturing industrial production dropped -0.4%.

Now we come to employment, otherwise known as where are the damn jobs? The manufacturing ISM employment index shot up 3.3 percentage points to 55.1%. The neutral point for hiring vs. firing is 50.1%.
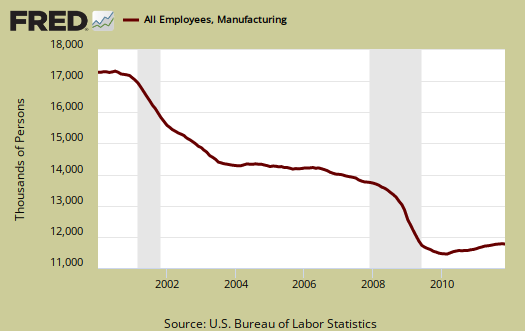
Below are the BLS manufacturing non-farm payrolls (jobs) for the past decade on the left, in red (December's numbers are out Friday), graphed against the ISM manufacturing employment index on the right, in blue. The BLS number is simply raw manufacturing jobs tally, not taking into account population growth or overall sector shrinkage as well as time lag. One can eyeball a slight correlation in the middle of the decade, yet note the divergence this recovery, starting late 2008.
Inventories contracted -1.2 percentage points to 47.1%, and remain in contraction. Yet the ISM claims:
An Inventories Index greater than 42.7 percent, over time, is generally consistent with expansion in the Bureau of Economic Analysis' (BEA) figures on overall manufacturing inventories (in chained 2000 dollars).
Changes in private inventories took off –1.35 percentage points from Q3 1.8% GDP.

Supplier deliveries are how fast manufacturers can get their supplies. A value higher than 50 indicates slower delivery times, a value below 50 means the supply chain is speeding up. These industries have slower supply times: Computer & Electronic Products; and Electrical Equipment, Appliances & Components. If one thinks about the hard drive shortage, that would be included in this sub-index.
The last time supplier deliveries registered below 50 percent was in May 2009, when the Supplier Deliveries Index also registered 49.9 percent. A reading above 50 percent indicates slower deliveries.

Backlog of orders increased +3.0 percentage points to 48.0%, which is still in contraction. Order backlogs are exactly what they sound like, how many new orders have delays in being filled.

Imports increased +5.0 percentage points to 54.0%. Imports are materials from other countries manufacturers use to make their products.

New orders destined for export, or for customers outside of the United States, increased +1.0 percentage point to 53.0%.

Prices increased +2.5 percentage points to 47.5%. Prices are what manufacturers pay to make their products.

Customer's inventories plunged -7.5 percentage points to 42.5% and have been in contraction for 33 months. Customer inventories, not to be confused with manufacturer's inventories, is how much customers have on hand, or rates the level of inventories the organization's customers have.

Here is the ISM growth and contraction sector ordered list:
Of the 18 manufacturing industries, nine are reporting growth in December, in the following order: Apparel, Leather & Allied Products; Printing & Related Support Activities; Textile Mills; Petroleum & Coal Products; Machinery; Food, Beverage & Tobacco Products; Computer & Electronic Products; Primary Metals; and Paper Products. The nine industries reporting contraction in December — listed in order — are: Plastics & Rubber Products; Nonmetallic Mineral Products; Furniture & Related Products; Chemical Products; Wood Products; Miscellaneous Manufacturing; Fabricated Metal Products; Transportation Equipment; and Electrical Equipment, Appliances & Components.
U.S. manufacturing PMI is bucking the European trend. Europe's manufacturing PMI contracted across the board for December, the 5th month in a row. China's PMI rebounded in December.
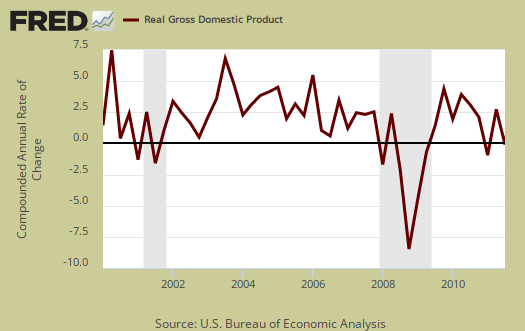
The ISM has a correlation formula to annualized GDP, but they are now noting the past correlation. Annualizing November's data, the ISM get a 4.0% 2011 annual GDP.
The ISM neutral point is 50. Above is growth, below is contraction, although the ISM is this report is noting some variance in the individual indexes. For example, A PMI above 42, over time, also indicates growth.
Last month PMI was 52.7%.
The ISM has much more data, tables and analysis on their website. For more graphs, see St. Louis Federal Reserve Fred database and graphing system.
Recent comments