
The April 2015 New Residential Single Family Home Sales surged 6.8% to 517,000 in annualized sales. For the year, new single family home sales are up 26.1% from the year ago 410,000 sales levels. The annual increase is well above the ±15.4% margin of error. In no uncertain terms people are buying up new homes again. Figures are annualized and represent what the yearly volume would be if just that month's rate were applied to the entire year. These figures are seasonally adjusted as well. The monthly percentage changes are always in between error margins (this month ±15.8%) and sales are almost always revised. Still sales are a blow out.

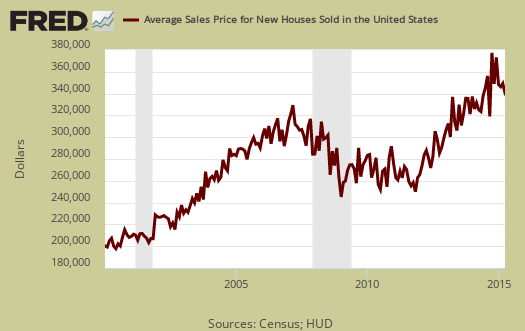
The April 2015 average home sale price was $341,500. This is a 5.0% increase from a year ago and almost no change, -0.5%, from last month.
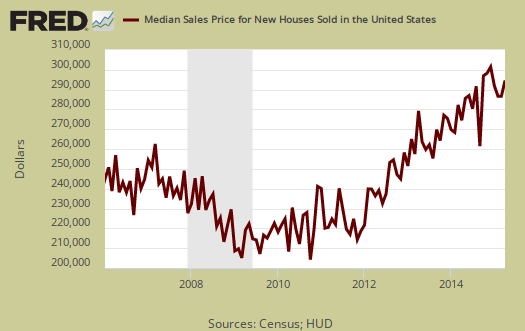
The median new home price is now frightening as most wage earners simply cannot afford it. The median home price is $297,300. From April 2014, the median new home sales price has increased 8.3%. Median means half of new homes were sold below this price and both the average and median sales price for single family homes is not seasonally adjusted.
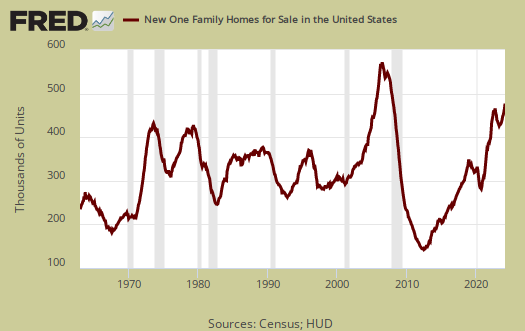
Inventories: New homes available for sale is now 205,000 units. This is a 7.3% increase from a year ago and outside the ±6.5% margin of error.
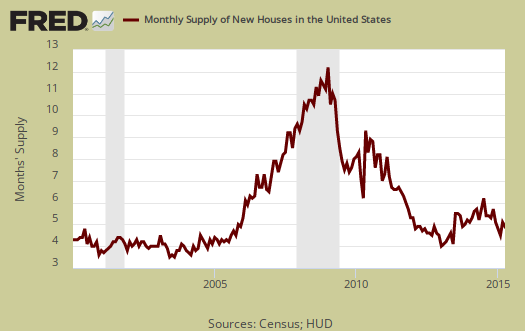
The graph below shows how long it would take to sell the new homes on the market at each month's sales rate. For April the time stands at 4.8 months. This is a -5.9% monthly change and a -14.3% annual one. Clearly the market is tightening up and heating up.
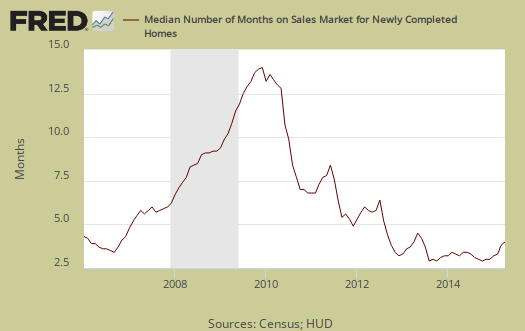
The median time a house was completed and on the market to the time it sold was 4.0 months. From a year ago that time period was 3.2 months. This implies the median time to move new properties is fairly stable.
Overall this report shows new home sales are increasing, although still below pre-recession levels. Even after the housing bubble popped new home sales were in the 600 thousand range. The median price is now completely out of reach as wages stagnate and the self-employed are shut out of the market due to tight mortgage qualifications. The median price is way above 2006 levels and just continues to soar. Seemingly unless one inherits a large sum of cash, we don't see how the average family can afford these prices. We do see so called investors buying up properties which will continue to inflate prices beyond the middle class means.
A note on Census New Home Sales survey report. The variance in monthly housing sales statistics is so large, in part, due to the actual low volume overall, along with the fact this is a survey. One needs to look at least a quarter to get a real feel for new home sales, but a year of sales data is more in order. Additionally this report, due to it's huge margin of error, is almost always revised significantly the next month. Buyer beware on month to month comparisons and reacting to primarily figures and why we graph up the statistics so one can identify a real trend versus press headline buzz. This is also why we produce so many graphs, one needs to see the overall trend, not focus on just monthly headline buzz percentage change figures.
The Census notes that the average revision is about 5% of the original reported. Here are our overviews of residential real estate statistics, only some graphs revised.
Recent comments