
The November 2012 Residential construction report showed housing starts decreased, -3.0%, from October. Both October and September was revised downward. October was revised from 894,000 housing starts to 888,000. September was revised down by 20,000, from 863,000 to 843,000. Housing starts have increased +21.6% from a year ago, outside the ±12.5% margin of error, but almost a halving from last month's reported year ago percentage increase of +41.9%. For the month, single family housing starts decreased -4.1%. Apartments, Townhouses & Condos or 5 units or more of one building structure, increased +1.4%. Home construction statistics have massive error margins, so don't bet the farm on the monthly percentage changes. The annual change is still significantly outside the margin of error.
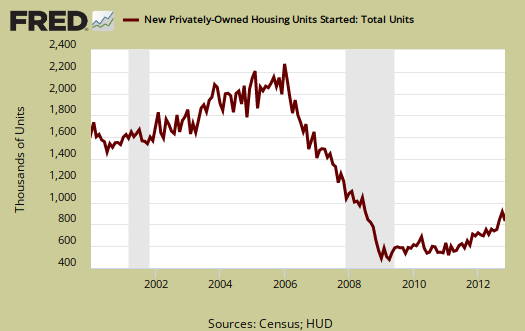
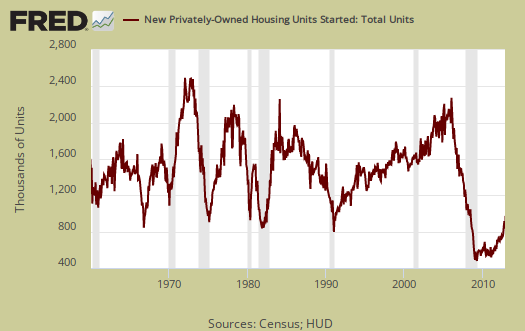
Housing starts are defined as when construction has broke ground, or started the excavation. One can see how badly the bubble burst on residential real estate in the below housing start graph going back all the way to 1960.
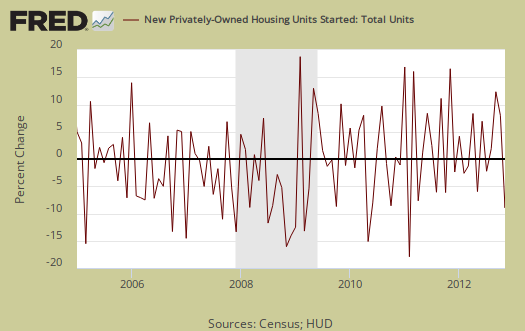
New Residential Construction housing starts has a margin of error way above the monthly percentage increases. This month has a error margin of ±14.3% percentage points on housing starts so the monthly percentage change is significantly within the margin to be considered accurate. That's why one should not get too excited on the monthly percentage change.
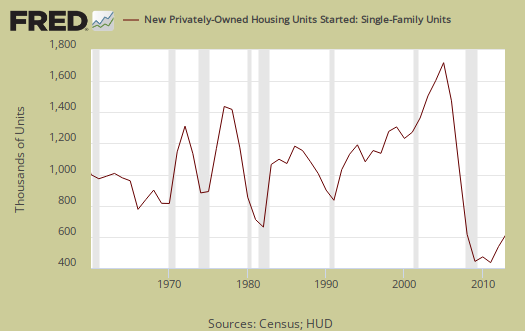
Single family housing is 75% of all residential housing starts. Below is the yearly graph of single family housing starts going back to 1960. Year 2012 is not complete, thus not shown in the below graph. Single family housing starts have increased by +22.8% from a year ago with a ±9.9% error margin.
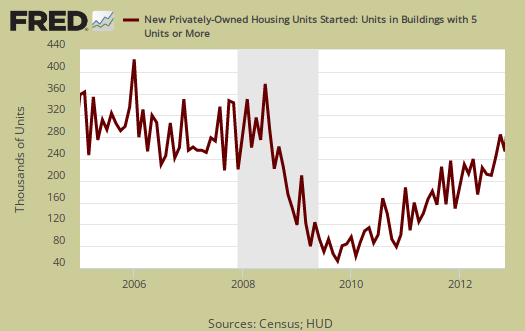
Housing starts of 5 or more units, or apartments, condos and townhouses, has increased +19.2% from a year ago, way down from last month's +62.9% reported annual increase. November's annual percentage change is still outside the margin of error of ±31.9%.
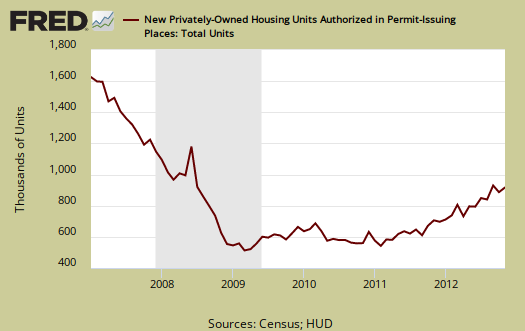
Building permits increased 3.6% to 899,000 and are up 26.8% from this time last year. The monthly change for building permits has a ±1.1% margin of error. In other words, building permits are much more accurate. Single family building permits decreased -0.2% from last month, but within the monthly ±0.8% error margin. The below graph shows building permits are not always a smooth line from month to month. Building permits are local jurisdictions giving approval, or authority to build.
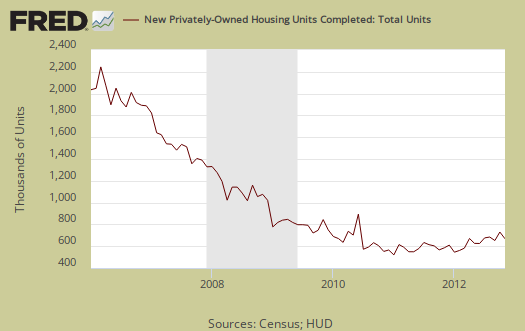
Housing Completions increased by +9.7% and are now up +16.1%, from a year ago, another halving of last month's reported +33.6% annual increase. Housing completions also have a large error margin, with a monthly error range of ±13.7% with an annual ±9.5% 90% confidence interval. Single family housing completions declined by -2.4% are up 14.3% from a year ago. Apartments really slid, with a monthly -29.2% decline and an annual percentage change of 22%. Housing completions mean either people have moved in or the carpet is laid down. In other words the house is done, including the flooring.
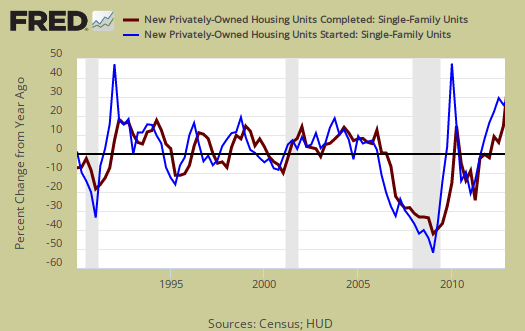
Single family housing completions lag housing starts by about 6 months, multi-family about twice that. Below are single family housing starts, three month average change from a year ago, plotted against single family housing completions, quarterly average level change from a year ago. We can see some pattern of the lag between the two. This graph only goes to Q3.

We are also now validated against those who claimed housing would increase 50%, 100% for 2012. They clearly were not looking at the below, the quarterly percentage change, from a year ago in housing starts versus housing completions, single family. It looks more on track to see an overall increase of 12-25% new single family homes constructed for 2012. Our best is in the middle of that range and even 25% seems optimistic considering the never ceasing attack on the middle class.
Additionally residential real estate fixed investment was 12% of Q3 GDP, clearly not a major driver of economic growth for Q3.
This report has a large variance, so to establish a trend line one must take into account really a year of data. This report is also seasonally adjusted and residential real estate is highly seasonal. The statistics are also annualized, which gives what the levels would be if one month's rates were the same for the entire year.
Below is the graph of single family housing starts on a monthly basis.
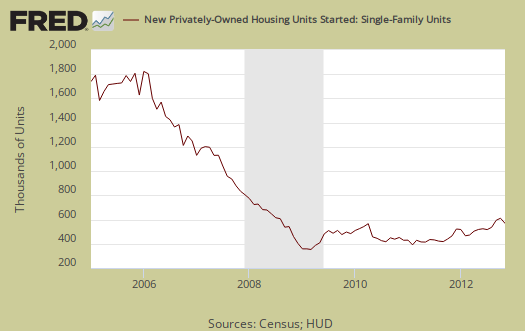
One can see this is still nowhere near housing bubble or even pre-bubble levels as well.
Here are our new construction overviews, only graphs revised.
it's amazing
that everyone else reports on such a release with a straight face:
"Housing starts have increased +21.6% from a year ago, outside the ±12.5% margin of error, but almost a halving from last month's reported year ago percentage increase of +41.9%."
reporting with a straight face
One of the main reasons I started overviewing these more minor monthly statistical releases is because so many in the financial and business press write pure bunk on these.
It's amazing because the government statistical agencies do a pretty good job at presenting the data and all one really needs to do is read it!
Yet over and over again, we see major spin and worse, many of these are written into HFT algorithms.
So, we have data which will be revised, is not real time, major error margins being written into algorithms trading trillions in a nanosecond.
So, we do our part trying to bring some number sanity is the statistical spin and it's a full time job!