
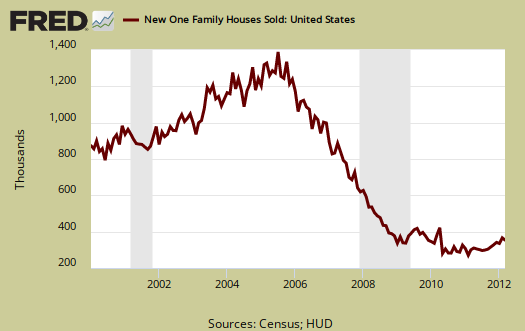
In March 2012, New Residential Single Family Home Sales decreased by -7.1%, or 328,000 annualized sales. This report has a ±20.7% error margin. February single family home sales were significantly revised, from 313,000, an originally reported -1.6% annualized monthly change to 353,000 new homes, a 7.3% change from January 2012. That's a massive swing and why one shouldn't bet the farm on this particular housing report.
New single family home sales are now 7.5% above March 2011 levels. A year ago new home sales were 305,000. Sales figures are annualized and represent what the yearly volume would be if just that month's rate were applied to the entire year.
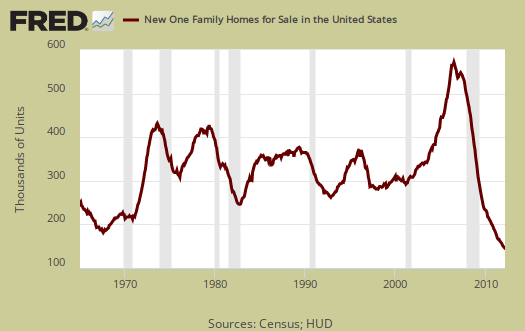
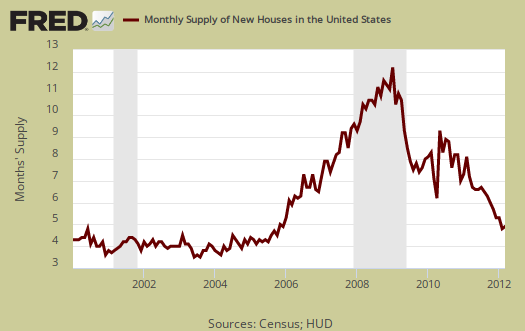
The supply of new homes for sale, are now at 5.3 months, assuming current sales rates. February's new homes inventory was revised to 5.0 months. The amount of new homes for sale was 144,000 units, annualized and seasonally adjusted. This is the lowest amount of single family new homes for sale ever, as shown in the below graph. Completed new single family homes is also at a record low, 48,000 units. Simply put, watch out for falling housing bottom calls from the press hitting you in the pocketbook.
Below is a graph of the months to sell new homes on the market at each month's sales rate. We can see these inventories vs. sales times have dropped dramatically, but at still at housing crash bubble time levels to sell them all.
The median time a house was for sale increased to 7.8 months. Below is a graph of the median time it took to sell the homes sold in March.

March's average price was $291,200. November 2003 the average single family new home price was $268,300. The average home price simply has not come down enough to meet that new normal of low wages for most of America. Homes above $750,000 registered a thousand sales this month.
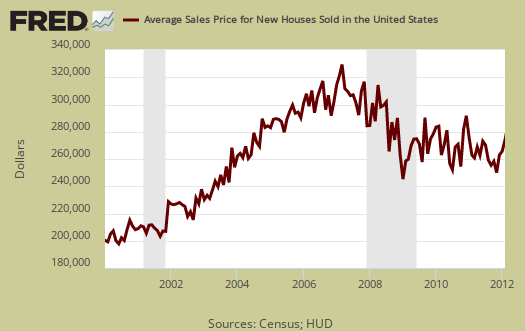
The median price was $234,500, whereas February's median price was $236,900. Median means half of new homes were sold below this price.

The variance in monthly housing sales statistics is so large, all one can say is the volume in new home sales seems to have stabilized to the new normal, of record lows, and inventories are returning to normal, which implies the new homes market has adjusted to the new normal or rolling around in the bottom. We hate the phrase new normal. Seriously, one can see by volume, the amount of new homes sold has dropped off a cliff. The result of a much smaller data pool is larger amounts of error. The raw number, not seasonally adjusted or annualized new homes sold in March was 32,000.
Calculated Risk is a fantastic analysis site on housing data and compares new home sales to recessionary periods and goes back to 1963 in data comparisons.
Last month's overview shows the February unrevised data.
many are calling a bottom in housing prices
We're not convinced. While many are looking at trends, statistics and convergence, the reason we're not convinced, fundamentally, is the out of alignment with wages that housing still is. Bottom line, one cannot afford a home @ even $200k when one makes $12/hr.
I don't think there will be major percentage drops, more a drifting lower or rolling around at these levels, so in a way that is a bottom.
But a price recovery, that, we can say just doesn't look likely.