
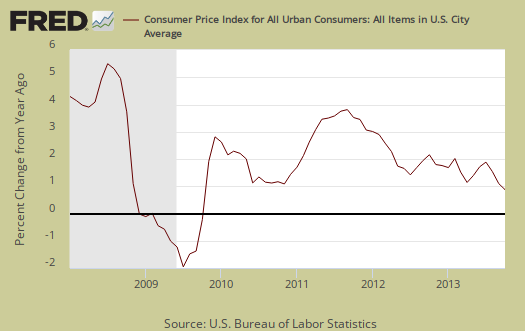
The monthly October Consumer Price Index declined by -0.1% on gas prices. CPI measures inflation, or price increases and for the year has increased 1.0%. This is the lowest annual inflation since the height of the Great Recession, October 2009. The shutdown also impacted data collection and October's sample size for prices is 25% less than normal as a result.

CPI has only increased 0.9% from a year ago as shown in the below graph. This is a very low annual rate of inflation and believe this or not, deflation can really harm an economy.
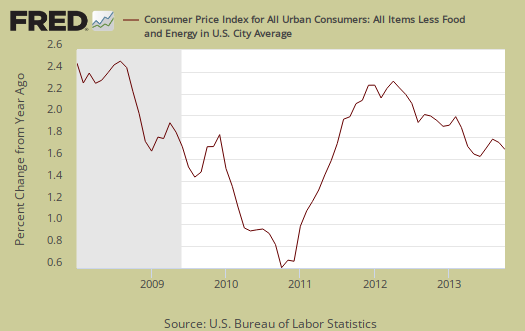
Core inflation, or CPI with all food and energy items removed from the index, increased 0.1%. Core inflation has risen 1.7% for the last year and since June 2011 has ranged from 1.6% to 2.3%. Core CPI is one of the Federal Reserve inflation watch numbers and 2.0% per year is their boundary figure. Graphed below is the core inflation change from a year ago.
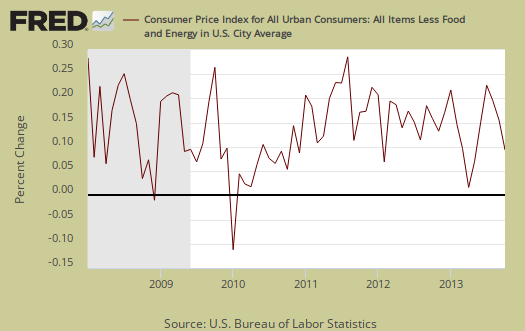
Core CPI's monthly percentage change is graphed below.
Energy overall declined -1.7% and energy costs are now down -4.8% for the entire year. The BLS separates out all energy costs and puts them together into one index. This index includes gasoline which plunged -2.9% for the month and has declined -10.1% for the year. . Natural gas is now up 4.4% from a year ago after a monthly decline of -1.0%. The fuel index also declined by -0.6% for the month and has declined by -4.6% for the year. Natural Gas and Fuel both increased in September so it appears some sort of price yo-yo happened to plunge energy prices overall so much in October. Energy costs are also mixed in with other indexes, such as heating oil for the housing index and gas for the transportation index. Below is the overall CPI energy index, or all things energy.

Graphed below is the CPI gasoline index only, which shows the volatility of gas prices. This isn't the first time, nor will it be the last, where the monthly inflation numbers move dramatically on gas prices and one must wonder what is going on with gasoline beyond supply and demand for prices to swing so wildly.

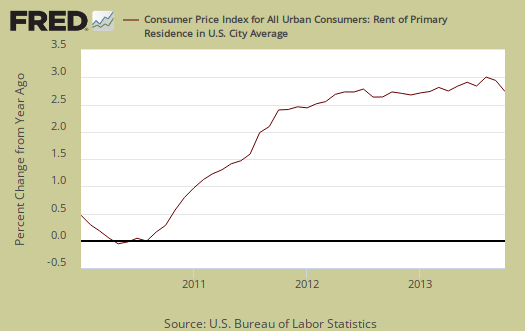
Core inflation's components include shelter, transportation, medical care and anything not food or energy. The shelter index is comprised of rent, the equivalent cost of owning a home, hotels and motels. Shelter increased 0.1%., the lowest increase since December 2012 yet is still up 2.3% for the year. Don't think renters and homeowners are getting a break, those sub-indexes of the shelter inflation metric both increased 0.2%. Hotels and Motels, known as lodging away from home is what nosedived, -3.1% in a month. Graphed below is rent, where cost increases hits the people who can least afford it.
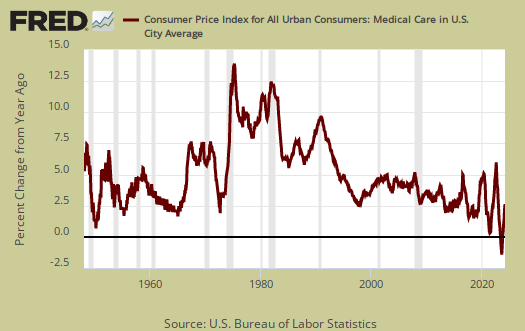
A core inflation cost which almost never drops is medical care. Medical care was unchanged this month, yet prescription drugs increased another 0.4%. The Medical care index has increased 2.3% over the last 12 months. Graphed below is the overall medical care index change from a year ago.
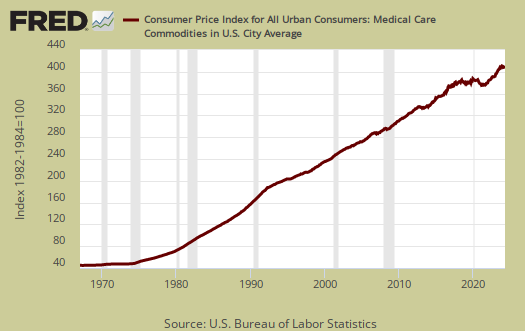
Below is a graph of the medical commodities index, which in large part consists of prescription drug prices and overall increased 0.4% for this month. Notice the beyond belief never ending increases since 1975. With all of the TV ads for overpriced, cancer risk side effect drugs running full stop every 7 minutes, don't expect prescription drugs price decreases anytime soon. Big Pharma's marketing costs have to be obscene and those costs are passed onto the American consumer.
Medical services prices decreased by -0.1% for October and have increased 2.9% for the year. Hospital services actually declined by -0.3%

Food and beverages overall increased 0.1% and have increased 1.3% from a year ago. The food at home index, known as your groceries, also increased 0.1% for the month. Food for home is now up 0.8% for the year and we think this index must be fiction for anyone going to the grocery sees the price increases on even the most basic food items. Eating out, or food away from home increased 0.1% from last month and is up 1.9% from a year ago. Graphed below is the overall food index.

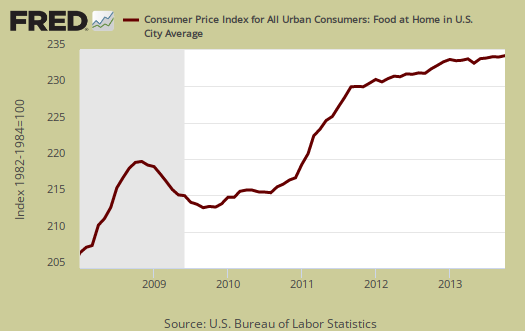
Graphed below is the food at home index. CPI does numerous substitutions on food, where if the price of steak increases, they claim hamburger is equivalent. Substitutions in part explain why you see $7 for some crappy frozen take out at the grocery, yet the food index rise appears relatively tame. We must wonder if the BLS believes people can switch to cereal from meat now. The details from the CPI report:
Among major grocery store food groups, the index for meats, poultry, fish, and eggs rose 0.6 percent, the largest increase of any group and its fifth increase in a row. The index for nonalcoholic beverages rose 0.4 percent after declining in each of the three previous months, and the fruits and vegetables index rose 0.2 percent after declining in September. In contrast to these increases, the index for cereals and bakery products fell 0.4 percent in October after risingin August and September. The indexes for dairy and related products and for other food at home both fell 0.2 percent after rising in September. The food at home index has risen 0.8 percent over the last 12 months. The indexes for meats, poultry, fish, and eggs, for fruits and vegetables, and for cereals and bakery products have risen over the span, while the indexes for nonalcoholic beverages, for other food at home, and for dairy and related products have declined.
Time will tell if a reduced sampling size impacted the accuracy of CPI, yet the trend for lower inflation was going on before the shutdown. The Fed believes core inflation should return to 2.0% a year levels, yet with this report, we suspect to hear more about the lack of inflation in the economy and an analysis as to why that is and what exactly is really going on. Do we have such low demand in the economy, even with the Fed buying up so many mortgage backed securities and treasuries daily that the nation is at risk of deflation at this point? The lack of wage increases in this country will most likely not be considered as a reason.
CPI details
The DOL/BLS does take yearly surveys on where the money goes in the monthly budget, but as one can see, food and energy are significant amounts of the monthly finances. Run away costs in these two areas can break the bank, so can food. Additionally CPI uses substitution, so if flour goes through the roof, somehow we're all just fine with oats and prices didn't really overall increase much. Here is the BLS CPI site, where one can find much more details, information on calculation methods and error margins.
Other CPI report overviews, unrevised, although most graphs are updated, are here. If you're wondering why the graphs display different figures from the text, the graphs calculate percentages from the index and do not round. The actual data from the BLS report does round to one decimal place. In other words, 0.05% is rounded to 0.1%.
Recent comments