
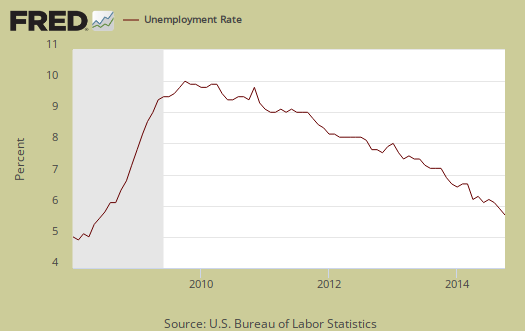
The BLS October current population survey unemployment report shows steady improvement in the unemployment situation continuing in 2014. The unemployment rate dropped to 5.8%, a rate not seen since July 2008. The unemployment rate dropped another one tenth of a percentage point on a dramatic monthly increase in employed as well as a drop in those unemployed. Those not in the labor force also declined for the month. The labor participation rate is still very low, 62.8%. From a year ago, the number of people employed has increased by 3.8 million.
This article overviews and graphs the statistics from the Employment report Household Survey also known as CPS. This survey tells us about people employed, not employed, looking for work and not counted at all. The household survey has large swings on a monthly basis as well as a large margin of error. The CPS has severe limitations, yet, it is our only real insight into what the overall population are doing for work.
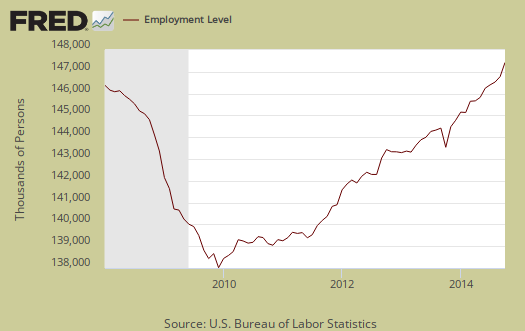
The ranks of the employed swelled by a whopping 683 thousand this month. Part of this figure is assuredly due to survey fluctionations. From a year ago, the employed has increased by 3.798 million and now tallies 147,283,000 as shown in the below graph. The increases over time show people really are getting jobs in 2014.
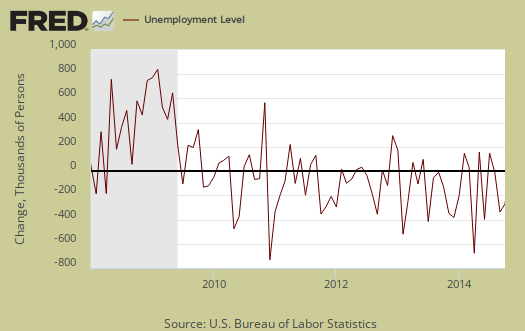
Those unemployed finally broke the 9 million barrier and now stands at 8,995,000. This is a -267,000 monthly decline. Below is the month change in unemployed and as we can see, this number normally swings wildly on a month to month basis generally, so a pattern of consecutive monthly declines is a very good sign.
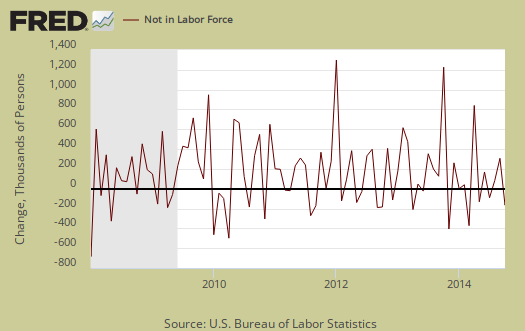
Those not in the labor force decreased by -206,000 persons and now stands at 92,378,000. The below graph is the monthly change of the not in the labor force ranks. Notice the increasing swells and wild monthly swings. Those not in the labor force has increased by 622 thousand in the past year.
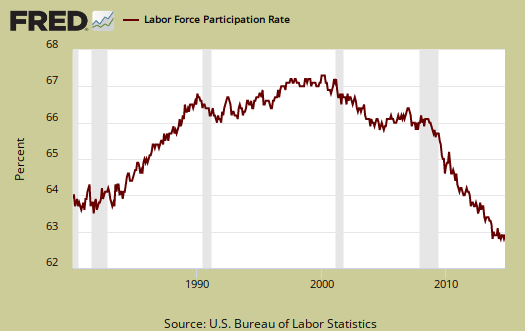
The most frightening statistic of the household survey is the labor participation rate, month after month. The labor participation rate is at 62.8%, a 0.1 percentage point increase from last month but still at record lows, as shown in the below graph.
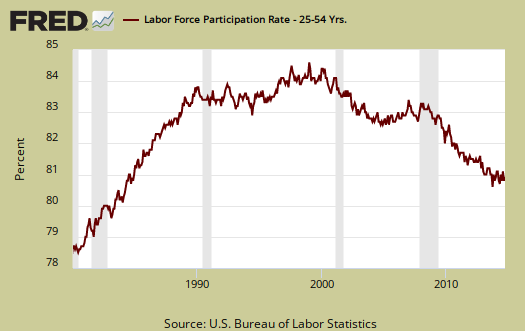
The low labor participation rate is not all baby boomers and people entering into retirement. Below is a graph of the labor participation rate for those between the ages of 25 to 54. These are the prime working years, so once cannot blame retirement and college on the declining participation rate. The 25 to 54 year olds labor participation rate ticked up 0.1 percentage point to 80.8% this month. Clearly some people of prime working age returned to the labor force in October. Still the 25 to 54 age bracket labor participation rates have not seen since the 1980's recession.
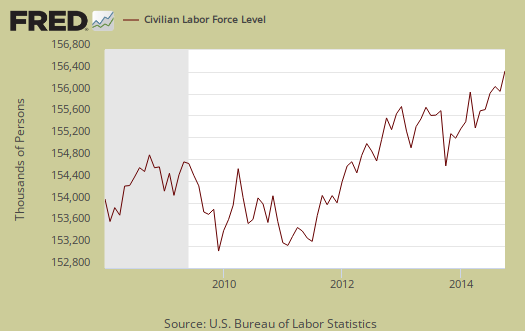
The civilian labor force, which consists of the employed and the officially unemployed, increased by 416 thousand this month. The civilian labor force has increased by1,653,000 over the past year. New workers enter the labor force every day from increased population growth. Yet those exiting the labor market must have sharply curtailed in October, implying people who dropped out of the labor force returned, although this explanation did not show up in other CPS data.
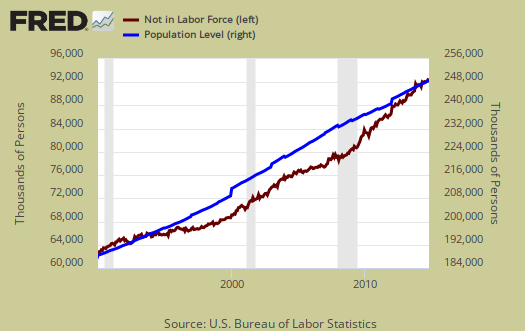
In spite of wild statistical swings, those not in the labor force often grows faster than the population which has the potential to work. Below is a graph of those not in the labor force, (maroon, scale on the left), against the noninstitutional civilian population (blue, scale on the right). Notice how those not in the labor force crosses the noninstitutional civilian population in growth and the accelerated growth started happening right in 2008. There were not enough babies born starting in 1943 to explain the steep 2008 increase in those not in the labor force.
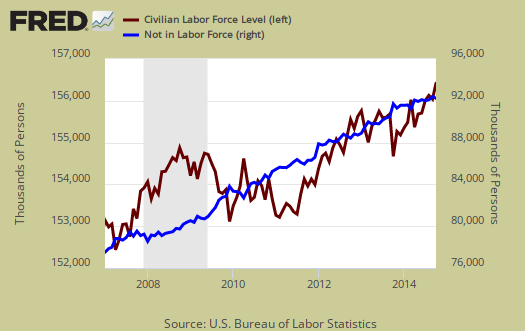
Below is a graph of the civilian labor force, or the official employed plus unemployed, in maroon, scale on left, against those not in the labor force, in blue, scale on right. Notice how those not in the labor force as a trend exceeded those considered employed and unemployed starting around mid 2009. What we have seen is a never ending growing segment of the population that is considered neither employed or unemployed, i.e. not in the labor force, increasing, above the trend line of those who would be naturally dropping out, such as the retired and those in school. Not in the labor force figures do include retirees and the size of the population greater than age 65 has grown.
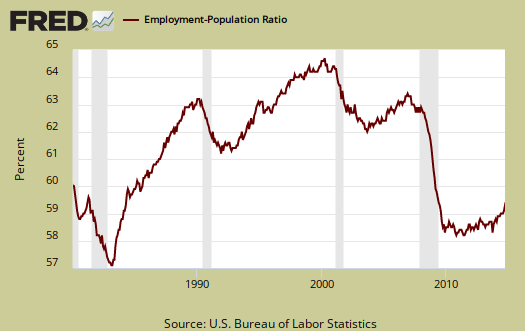
Those considered employed as a ratio to the total Civilian noninstitutional population now stands at 59.2%, a 0.2 percentage point uptick from last month. For the interested, there is a relationship between the employment-population ratio and the labor participation rate (LPR): employment-population ratio = LPR * (1 - unemployment rate).
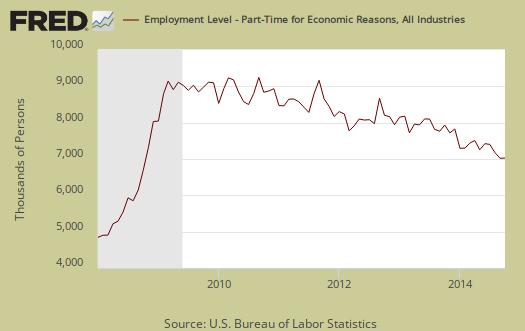
There are millions of people who need full-time jobs with benefits who can't get decent career oriented positions. Those forced into part time work is now 7,027,000, an decrease of -76,000 from last month. Those stuck in part-time hours has declined by -989 thousand from a year ago, which is great. The below graph shows levels of people who could only get part time hours have remained elevated since the recession, so this figure finally moving lower is a great sign.
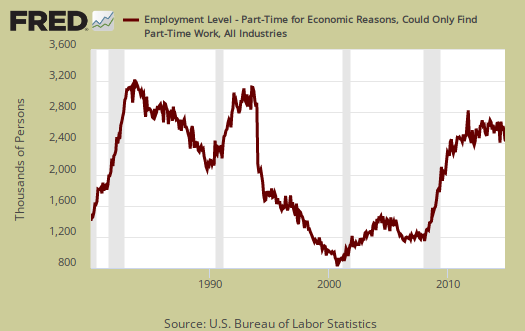
There are two categories of those working part-time hours. Those who could only get part-time jobs and those working who got their hours cut due to businesses not having enough work for them. The number of people who could only get part-time work decreased by -115 thousand to 2,447,000. The number of people who could only find part-time work is shown in the below graph and from a year ago has dropped by only -138,000.
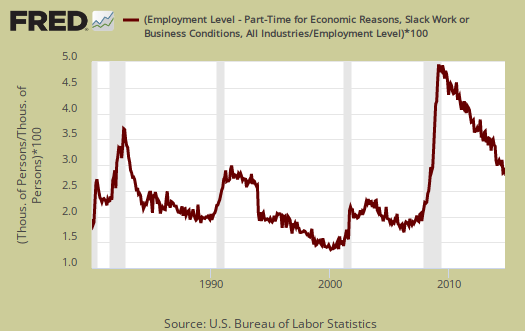
People can also be stuck with part-time hours due to slack working conditions. This figure has really dropped in the past year and this month is 4,214,000 From a year ago those who are getting their hours slashed due to weak economic demand has declined by -16%,or -811 thousand Below is a graph of forced into part-time work because they got their hours cut, as a percentage of the total employed. Part-time work due to cut hours is known as slack work conditions. Slack working conditions causing part-time hours remaining high or increasing implies economic conditions have not improved enough, that there still is just not enough demand in the economy for businesses to run full steam. Below is a graph of forced part-timers due to slack work conditions as a percentage of the civilian labor force. This is a recession economic indicator, notice the line slope matches strongly the gray recession bars of the graph. Part-time work due to a crappy economy has clearly improved dramatically over the last year.
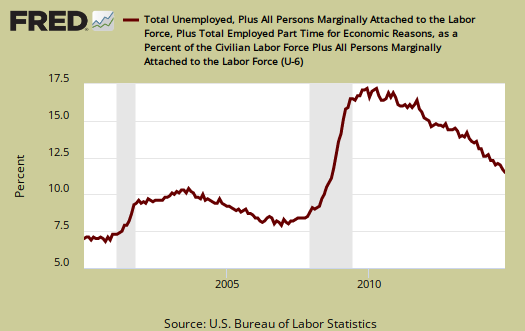
U-6 is a broader measure of unemployment and includes the official unemployed, people working part-time hours because that's all they can get and a subgroup not counted in the labor force but are available for work and looked in the last 12 months . The U-6 alternative unemployment rate still leaves out some people wanting a job who are not considered part of the labor force. U-6 stands at 11.5%.
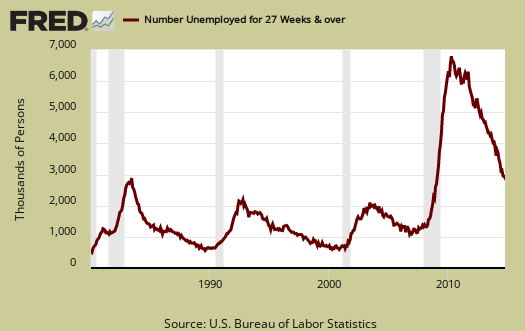
The long term unemployed, or those unemployed for 27 weeks and over, dropped by -38,000 to stand at 2,916,000 people. From a year ago the long term unemployed ranks have decreased by -28%, but this does not mean at all these 1.131 million folk found work.
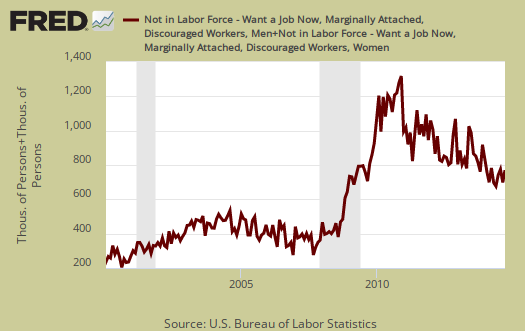
The marginally attached are people not in the labor force because they have not looked for a job in the last month, but have looked for a job in the last year. This number has ballooned since 2007 and not returned to pre-recession levels. It's like a perpetually static figure at this point. The graph below is the number of people considered marginally attached to the labor force, currently at 2.192 million. The marginally attached should only be viewed as a long term trend for the figures are also not seasonally adjusted.
Discouraged workers are people, not counted as part of the civilian labor force, who not only want a job, but also looked for one in the last year. These people aren't job hunting now because they believe there are no jobs out there. Below is the graph of discouraged workers, currently at 770 ,000 people and are a subset of the marginally attached.
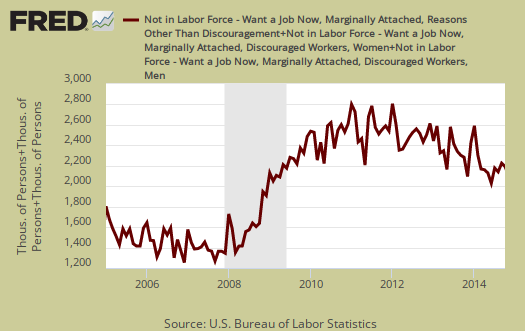
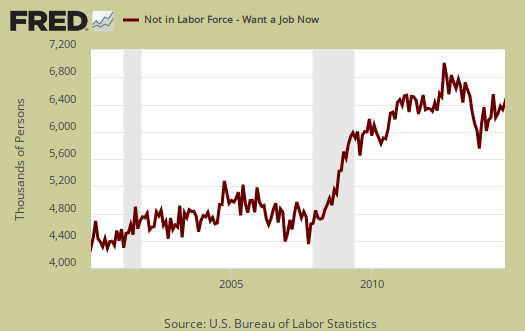
Our favorite statistic from the CPS survey is how many people who are considered not in the labor force, report they want a job now. It is a direct survey question from the CPS. The survey asks people who are not being counted in the unemployment statistics and official unemployment rate if they want a job. The number who answer yes currently stands at 6,537,000, a very large number of people. Those who are not counted yet report they want a job includes the discouraged workers and marginally attached and is seasonally adjusted. This figure has increased by 437 thousand or 7.2% from a year ago. If the job market was really great, this figure should drop along with the unemployment rate as these people rejoin the job hunt.
The average length of unemployment is 32.7 weeks and a year ago was 36.0 weeks. That's not much of a drop over the past year, pushed up in part due to the long term unemployed
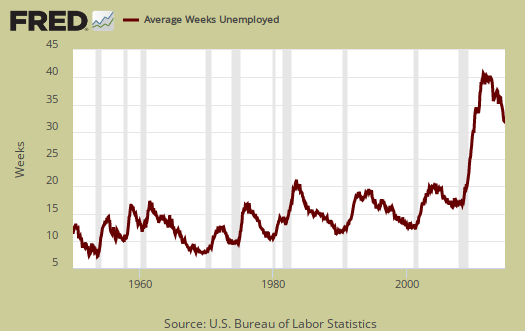
The median time one is unemployed, which means 50% of people have gotten a job in this amount of time is 13.7 weeks. A year ago this figure was 16.5 weeks, so finding job has improved slightly over the past year. Over three months without work for half of the people looking is still a very long time.

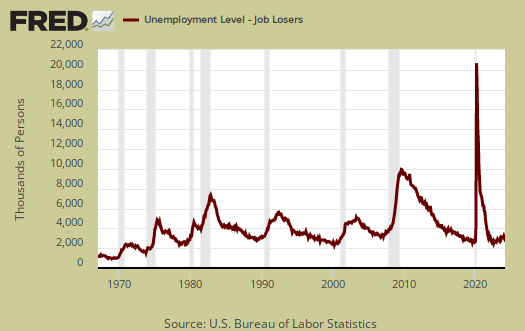
The household survey gives the reason for new unemployment status. Job losers and those who completed temporary jobs dropped by -172,000 and stands at 4,358 ,000. Below is a graph of job losers by levels. While the figure has dropped dramatically in the past year (-1.8 million!), it is still higher than any other recession.
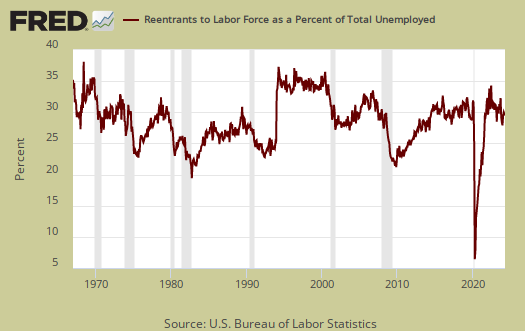
People join the ranks of the unemployed because they were laid-off, fired, they quit, the job was temporary and thus ended, they entered the labor force for the first time and re-entrants. Re-entrants are people with work experience, yet have been considered not in the labor force for some time. Recall to be considered unemployed one has to be actively searching for a job or expecting to be recalled and on temporary layoff. Re-entrants increased by 62 thousand people this month. Below are re-entrants as a percentage of the total unemployed. As you can see, as jobs and opportunities appear, people re-enter the labor force looking to snap one of those jobs. If there were really a lot of job opportunities out there, the slope of this graph would spike up and should spike up to the extremes since there are so many who have stopped looking, are not counted as unemployed currently, who could re-enter the labor market.
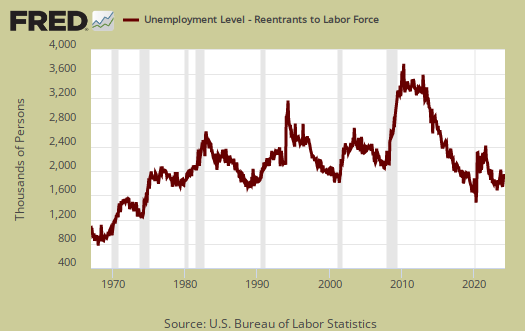
Re-entrant unemployed levels, graphed below, are yet another sign on how people are not finding work, giving up, then dropping out of the labor force and then trying again to get a job. If the job market was good for a long period we'd see this statistic drop as new entrants would have found work instead of being once again officially counted as unemployed.
This month's household survey shows the employment situation really improving. Yet America still needs another six months of this level of growth to get those long term unemployed and not in the labor force back working again. The age 25 to 54 labor participation rate is also another figure to watch. Just seems absurd, almost seven years of misery and things are just now getting off the ground again for U.S. labor.
Here is our past overviews CPS unemployment statistics.
Recent comments