
The National Association of Realtors Pending Home Sales declined by -1.8% in June 2015. Pending home sales are still up 8.2% from a year ago and had previously increased for five months in a row. This is the third highest amount of pending home sales for 2015 but sales have increased year over year for ten months now.
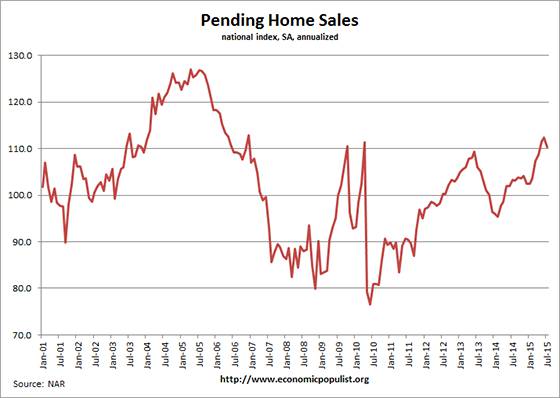
The above graph shows pending home sales have recovered to 2006 bubble year levels. The NAR notes first time home buyers are really not the cause for the overall recovery but people who are no longer underwater in their mortgages finally and want to trade in and up are. From the NAR:
Existing-home sales are up considerably compared to a year ago despite the share of first-time buyers only modestly improving. The reason is that the boost in sales is mostly coming from pent-up sellers realizing their equity gains from recent years.
Competition for existing houses on the market remained stiff last month, as low inventories in many markets reduced choices and pushed prices above some buyers' comfort level. The demand is there for more sales, but the determining factor will be whether or not some of these buyers decide to hold off even longer until supply improves and price growth slows.
The PHSI are contracts which have not yet closed and why pending home sales are considered a future housing indicator. The PHSI represents future actual sales, about 45 to 60 days from signing. From the NAR:
NAR's Pending Home Sales Index (PHSI) is released during the first week of each month. It is designed to be a leading indicator of housing activity.
The index measures housing contract activity. It is based on signed real estate contracts for existing single-family homes, condos and co-ops. A signed contract is not counted as a sale until the transaction closes. Modeling for the PHSI looks at the monthly relationship between existing-home sale contracts and transaction closings over the last four years.
The west coast has seen a massive run up in home prices that are completely out of whack with income levels in the areas. The declines were in the Midwest and the South. Below are the NAR regional pending home sales figures:
The PHSI in the Northeast inched 0.4 percent to 94.3 in June, and is now 12.0 percent above a year ago. In the Midwest the index declined 3.0 percent to 108.1 in June, but is still 5.0 percent above June 2014.
Pending home sales in the South also decreased 3.0 percent to an index of 123.5 in June but are still 7.8 percent above last June. The index in the West increased 0.5 percent in June to 104.4, and is now 10.4 percent above a year ago.
The Case-Shiller home price index still shows double inflation annual price gains with regions still simply exploding in price.
Probably the worst of this report is the prediction home prices will blow out at the bubble year gain levels. This is while first time home buyers are squeezed out, with tight standards and 20% down payments required.
The national median existing-home price for all housing types in 2015 is expected to increase around 6.5 percent to $221,900, which would match the record high set in 2006. Total existing-home sales this year are forecast to increase 6.6 percent to around 5.27 million, about 25 percent below the prior peak set in 2005 (7.08 million).
May was a nine year pending home sales high and the NAR believes it is a matter of inventories causing June's decline, yet the NAR and their economists are always warm fuzzy pie in the sky in their analysis. Others are pointing to housing data leveling off.
Competition for existing houses on the market remained stiff last month, as low inventories in many markets reduced choices and pushed prices above some buyers' comfort level,
Here are our past pending home sales overviews, unrevised.
Recent comments