
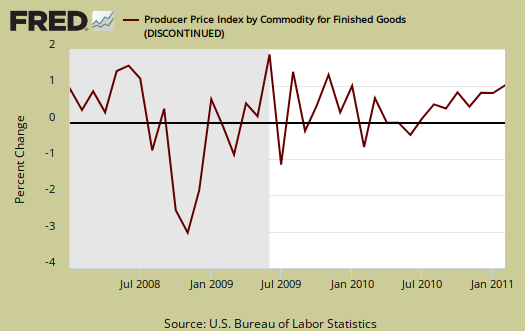
The Producer Price Index for finished goods increased 1.6% in February 2011. The PPI measures prices obtained for U.S. goods. Intermediate goods prices increased 2.0% and crude or raw materials prices went up 3.4%. PPI is often called wholesale inflation by the press.
The reason finished goods prices increased was energy, up 3.3% in one month and food soared 3.9% in one month. The increase in gas caused 45% of the energy finished goods increase. The Finished foods index monthly increased was 70% vegetables, which soared 48.7% in a month. It's unclear if the freeze and crop destruction in Mexico has something to do with this.
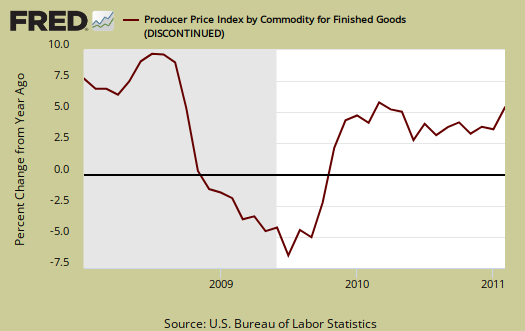
For the year, finish goods PPI increased 5.6%, the largest increase since March 2010.
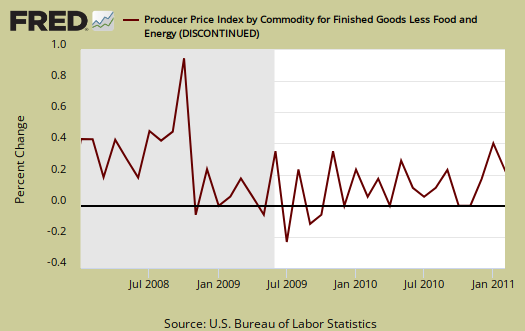
Core PPI or finished goods minus food and energy, increased 0.2% for February 2011. There was a 0.6% price increase for passenger autos in core PPI and this was 20% of the total core PPI monthly increase.
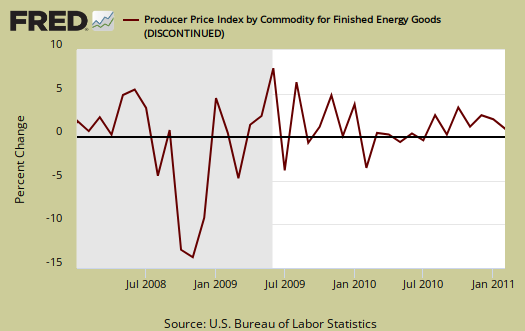
Below is the monthly percentage change of finished energy only, to show the increase in prices.
Crude in the Producer Price Index means the items which are used for further processing, or to make other stuff and it rose 3.4% in February 2011. Here food really rears it's ugly head in terms of wholesale price inflation. Crude core or crude stuff minus food and energy, increased 2.3% for February. Seems metal ores are getting expensive.
The Producer Price Index for crude materials for further processing rose 3.4 percent in February. For the 3 months ended in February, prices for crude materials climbed 13.8 percent, subsequent to a 6.7 percent increase for the 3 months ended November 2010. Over three-fourths of the February over-the-month advance is attributable to the index for crude foodstuffs and feedstuffs, which jumped 6.7 percent.
Also contributing to the rise in prices for crude goods, the indexes for crude nonfood materials less energy and crude energy materials moved up 2.3 percent and 0.9 percent, respectively.
For the year, Finished goods PPI is up 5.6%. Below is the Finished goods PPI percent change for the year.
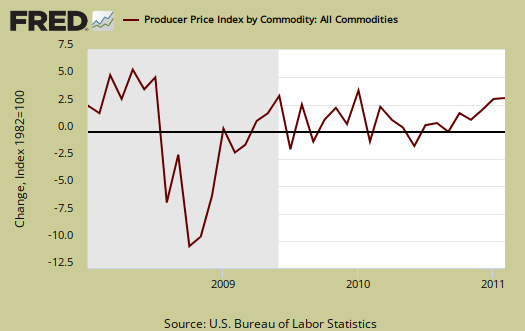
Below is the indexed price change for all commodities. Commodities are not limited to what comes from inside the United States.
Here is the BLS website for more details on the Producer Price Index.
must read post on global commodity prices in pictures
Over on Econbrowser is a great post comparing global commodity prices to industrial production as well as the component breakdown of commodities and additional.
Very useful in terms of the demand side of the rise in prices as well as the highest increasing costs.