
Q2 2010 Productivity & Costs was released today. Labor productivity decreased -0.9%. Output increased 2.6% and hours worked increased 3.6%.
Most horrific from the report is the statistics on manufacturing unit labor costs. They dropped -6.1% in the 2nd quarter and 6.9% for the year. This is the largest drop since the government started tracking manufacturing wages in 1988. Durable goods (think auto) manufacturing unit labor costs dropped -11.4% for the quarter and -10.2% for the year.
The basic equation for labor productivity is , where Q is the total output of industry.
L, or Labor, is measured in hours only. Both values are normalized to a base year. Note this normalization to a base year, seemingly now to be 2005, where the mass exodus to China and India on jobs had already occurred.
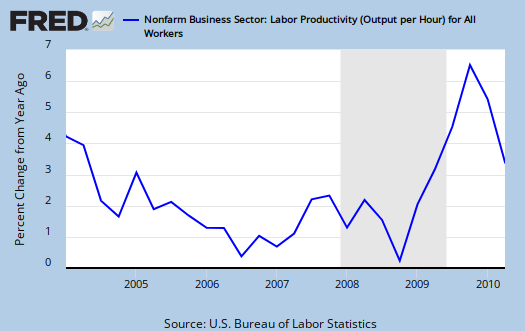
Below is productivity, compounded against last quarter percent change:

Productivity yearly change, which was 3.9%.
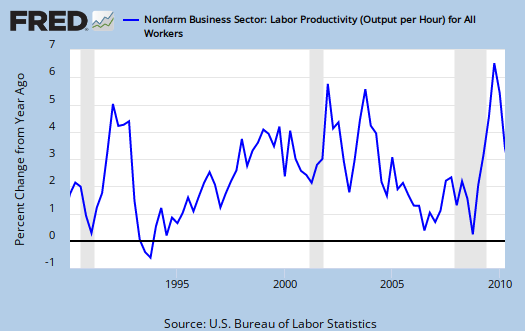
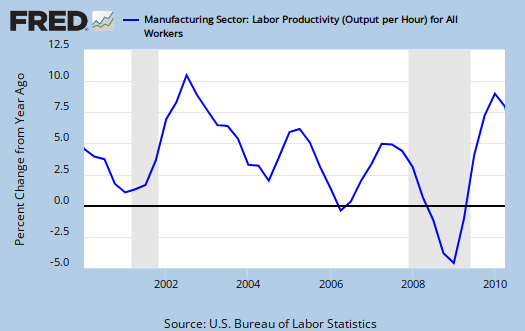
Below is a output per hours worked graph from 1990 until Q2 2010. Notice the huge spike in 2002, the same year corporations insisted on offshore outsourcing everything that wasn't nailed down, using the recession as cover. Output for the year was 3.9%.
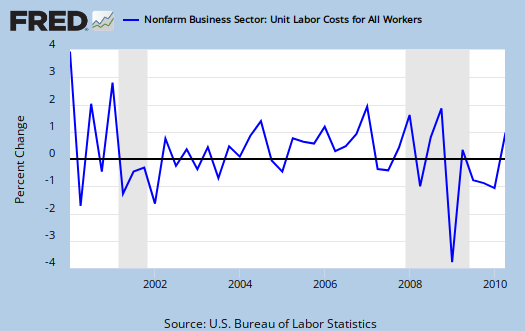
Below is the unit labor costs, compounded annual rate, percent change. Unit labor costs increased 0.2% for Q2 2010, but are still down -2.8% for the year.
BLS defines unit labor costs as the ratio of hourly compensation to labor productivity.

Unit Labor Costs, change from the previous quarter:
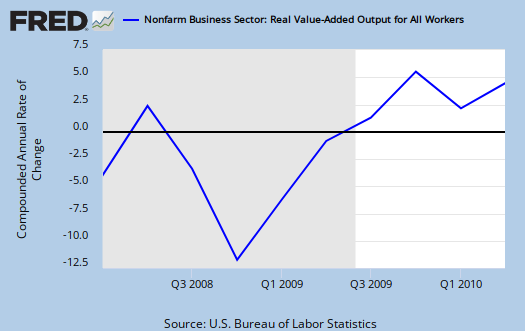
Below is the actual output graph. Output for Q2 2010 increased 2.6%, for the year, 3.9%, a clear slow down in output for Q2 2010.

How does the DOL calculate labor productivity?
Labor productivity is calculated by dividing an index of real output by an index of the combined hours worked of all persons, including employees, proprietors, and unpaid family workers.
This is all calculated from BSL CES and Current Population survey data and is in part, estimated.
Note how manufacturing labor costs are way down, yet manufacturing productivity is soaring, 4.5% in Q2 2010 and 7.5% for the year. Hours worked increased 3.6%, yet unit labor costs were down -6.9% for the year. The overall manufacturing sector includes durable and non-durable goods. Non-durable manufacturing productivity decreased -2.8%

Durable manufacturing productivity increased 11.2%. Output gained 14.1% in Q2 2010 for durable manufacturing, 12.1% for the year. Yet real wages dropped. -0.7% for the quarter, -1.6% for the year.
What you see these days in productivity is not what it appears. Due to globalization, workers get squeezed, production outsourced and productivity soars. Hence if output increased and productivity decreased, well, that's probably a better sign for the U.S. middle class. It means businesses cannot squeeze labor further and to increase output, they might have to actually pay a few more people. Hopefully those people will be American workers.
The problem with this report is overall output is also slowing down and that means...employers won't be forced to hire U.S. workers because they are not producing as much stuff.
The Durable goods report is also most telling. While their productivity soars, their labor costs drops. We know new auto workers are making half as much as others and we also know GM employs more people in China than in the United States.
Productivity and Costs were also heavily revised and the entire report, including revisions is hosted locally here.
Here is the Q1 2010 productivity report, (only graphs updated).
Recent comments