
Q2 GDP has been significantly revised upward from 2.3% to 3.7%. Investment was dramatically revised upward as was spending by state and local governments. Consumer spending was a healthy 57.2% of real GDP. Also surprising was a lack of upward revisions in imports. Regardless, that is a 1.37 percentage point GDP revision, a 59% change from the advance report. Wall Street welcomes the growth news although gambling the Fed won't raise rates in September due to global market volatility might now be loser bets.
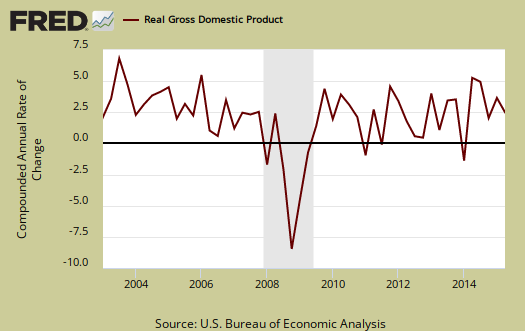
As a reminder, GDP is made up of: where Y=GDP, C=Consumption, I=Investment, G=Government Spending, (X-M)=Net Exports, X=Exports, M=Imports*. GDP in this overview, unless explicitly stated otherwise, refers to real GDP. Real GDP is in chained 2009 dollars.
The below table shows the Q2 GDP component revision comparison. As we can see investment was significantly revised upward and the usual mass of imports did not materialize.
| Comparison of Q2 2015 revision and Q2 2015 advance GDP Components | |||
|---|---|---|---|
|
Component |
Q2 2nd Revision |
Q2 Advance (1st) |
Spread |
| GDP | +3.69 | +2.32 | +1.37 |
| C | +2.11 | +1.99 | +0.12 |
| I | +0.88 | +0.06 | +0.82 |
| G | +0.47 | +0.14 | +0.33 |
| X | +0.65 | +0.67 | -0.02 |
| M | -0.42 | –0.54 | +0.12 |
The below table shows the GDP component comparison in percentage point spread from Q1 to Q2. This is quite an amazing bounce back.
| Comparison of Q1 2015 and Q2 2015 GDP Components | |||
|---|---|---|---|
|
Component |
Q1 2015 |
Q2 2015 |
Spread |
| GDP | +0.64 | +3.69 | +3.05 |
| C | +1.19 | +2.11 | +0.92 |
| I | +1.39 | +0.88 | -0.51 |
| G | -0.01 | +0.47 | +0.48 |
| X | -0.81 | +0.65 | +1.46 |
| M | -1.12 | –0.42 | +0.70 |
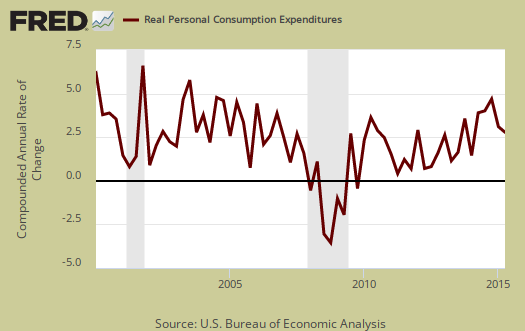
Consumer spending, C is quite strong with over two percentage points of contribution to Q2 GDP. Motor vehicles came back with a 0.26 percentage point contribution. Durable goods overall was a 0.59 percentage point contribution. Consumer spending services added 0.93 percentage points with health care by itself adding 0.28 percentage points to GDP. Revisions in consumer spending were overall minor. Below is a percentage change graph in real consumer spending going back to 2000.
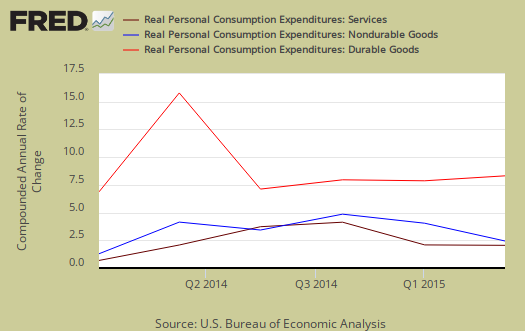
Graphed below is PCE with the quarterly annualized percentage change breakdown of durable goods (red or bright red), nondurable goods (blue) versus services (maroon).
Imports and Exports, M & X were a small 0.23 percent point positive GDP growth contribution. This was a 0.10 percentage point contribution upward revision. We suspect oil was the cause for the lower trade deficit as a global slowdown in demand is occurring.

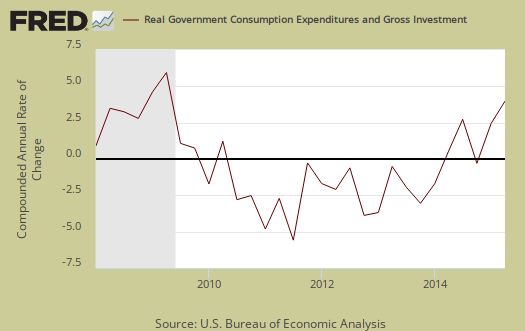
Government spending, G contributed 0.47 percentage points to Q2 GDP. The was significantly revised up over quarter of a percentage point. The revision came from state and local government investment. Originally this was 0.18 percentage points and was revised to 0.43 percentage points of GDP contribution.
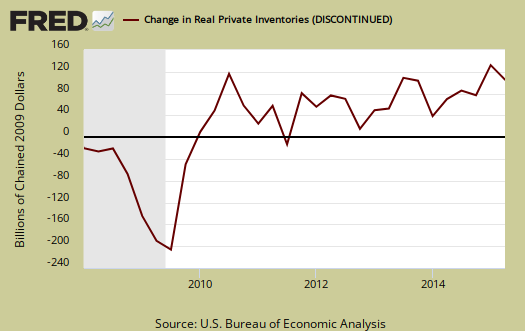
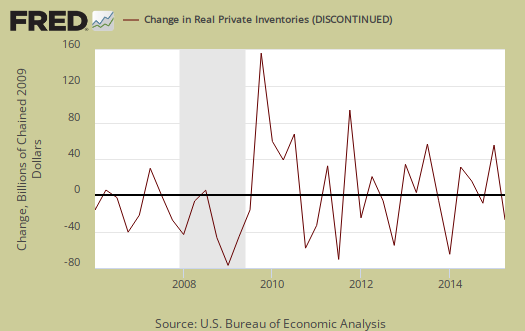
Investment, I is made up of fixed investment and changes to private inventories. Investment was significantly revised from a paltry 0.06 percentage points to Q2 GDP to 0.88 percentage points. The change in private inventories alone was revised from a -0.08 percentage point contribution to 0.22 percentage points. Below are the change in real private inventories and the next graph is the change in that value from the previous quarter.
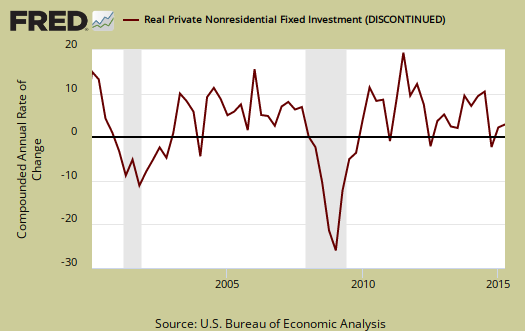
Fixed investment is residential and nonresidential and was revised from 0.14 percentage points to 0.66 percentage points of GDP contribution. Nonresidential was a 0.41 individual percentage point contraction on a 0.26 industrial equipment percentage point contribution and our favorite, a laughable, 0.34 percentage point contribution on intellectual property products. One must wonder how fictional is this category since intellectual property is packaged into special purpose vehicles located outside of the United States in tax haven areas.
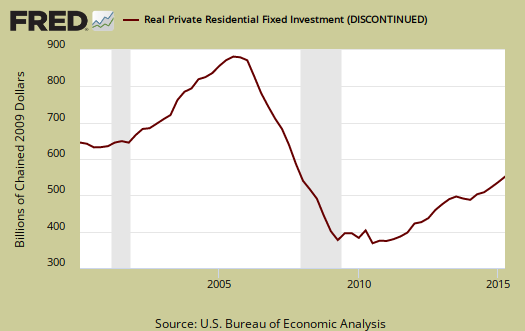
Residential fixed investment added 0.25 percentage points to GDP. The below graph shows residential fixed investment.
Nominal GDP: In current dollars, not adjusted for prices, of the U.S. output,was $17,902 billion, a 5.9% annualized increase from Q1. In Q1, current dollar GDP increased 0.8%.
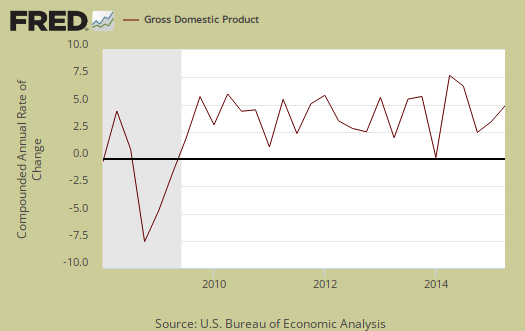
Real final sales of domestic product is GDP - inventories change. This figures gives a feel for real demand in the economy. This is because while private inventories represent economic activity, the stuff is sitting on the shelf, it's not demanded or sold. Real final sales increased 3.5%. This is the better news of this report, as Q1 showed a real final sales -0.2% contraction.

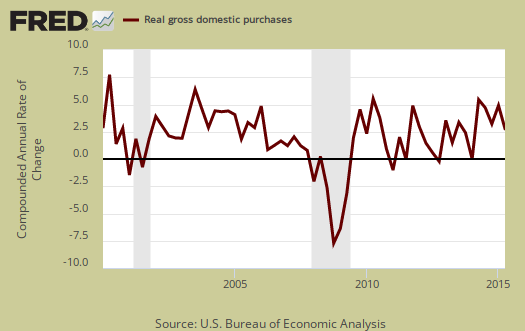
Gross domestic purchases are what U.S. consumers bought no matter whether it was made in Ohio or China. It's defined as GDP plus imports and minus exports or using our above equation: where P = Real gross domestic purchases. Real gross domestic purchases increased 3.4% in Q2. Exports are subtracted off because they are not available for purchase by Americans, but imports, of course are available for purchase in the U.S. When gross domestic purchases exceed GDP, that's actually bad news, it means America is buying imports instead of goods made domestically. Q1 saw a 2.5% increase in gross domestic purchases.
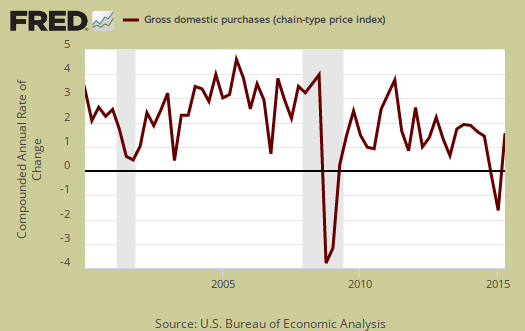
The price index for gross domestic purchases increased 1.5% for Q2. This was a 0.1 percentage point uptick from the advance GDP estimate. Without food and energy considered, the core price index increased 1.2%. This is must higher than Q1's 0.2%, yet below the Federal Reserve's target inflation rate. Below is the price index for gross domestic purchases.
GNP - Gross National Product: Real gross national product, GNP, is the goods and services produced by the labor and property supplied by U.S. residents.
GNP = GDP + (Income receipts from the rest of the world) - (Income payments to the rest of the world)
Real GNP increased 3.4% for Q2. In Q1 GNP decreased by -0.2%. GNP includes, whereas GDP excludes, net income from the rest of the world. GNP increases beyond GDP if Americans made out like bandits from foreign investments more than foreigners cashed in on investments within the U.S. borders.

GDI - Gross Domestic Income: Gross Domestic Income is all income from within the borders of a nation and should normally equal GDP. GDI is wages, profits & taxes minus subsidies. Real GDI was 0.6% in Q2. Q1 GDI was a 0.4% increase. The BEA says GDI measures the economic output as the costs incurred as well as incomes earned in the production of GDP. The BEA also states GDI can have statistical discrepancy over short time periods.

Below are the percentage changes of the Q2 2015 GDP components, from Q1. The thing to notice is how exports improved for Q2. There is a difference between percentage change and percentage point change. Point change adds up to the total GDP percentage change and is reported above. The below is the individual quarterly percentage change, against themselves, of each component which makes up overall GDP. Additionally these changes are seasonally adjusted and reported by the BEA in annualized format.
|
Q2 2015 GDP Component Percentage Change (annualized) |
|||
|---|---|---|---|
| Component | Percentage Change from Q1 | ||
| GDP | +3.7% | ||
| C | +3.`% | ||
| I | +5.2% | ||
| G | +2.6% | ||
| X | +5.2% | ||
| M | +2.8% | ||
With never ending revisions to GDP, one starts to wonder the value of this report in the first place. At best the GDP report is becoming more crude in understanding what is really going on in the economy.
Other overviews on gross domestic product can be found here. The BEA GDP site is here.
Recent comments