
Q3 GDP 2011 came in at 2.5%.. Here is the original BEA GDP report. Q2 2011 GDP remained the same at 1.3%.

Q3 GDP had a sharp increase in personal consumption and a drop in private inventories, a bump up in fixed investment that wasn't housing and Uncle Sam's contributions helped offset the States.
As a reminder, GDP is made up of:
where Y=GDP, C=Consumption, I=Investment, G=Government Spending, (X-M)=Net Exports, X=Exports, M=Imports*.
Here is the Q3 2011 advance report breakdown of GDP by percentage point contributions. The BEA rounds to one decimal place, Q3 GDP was actually 2.45%
- C = +1.72
- I = +0.52
- G = 0.00
- X = +0.55
- M = –0.34
Here is the Q2 2011 report, with the latest revisions, breakdown of GDP by percentage point contributions. Without rounding, Q2 GDP was 1.34%.
- C = +0.49
- I = +0.79
- G = –0.18
- X = +0.48
- M = –0.24
Below are the percentage point differences, or spread between the Q3 advance and Q2 2011 GDP report components. This represents the change of gross domestic product growth contributions from Q2 to Q3. The quarterly change in private inventories was a -0.80 spread and trade was a -0.02 point spread.
- C = +1.23
- I = -0.27
- G = +0.18
- X = +0.07
- M = -0.10
Below the the St. Louis FRED graph for C, or real personal consumption expenditures of the above GDP equation. As we can see from the above, PCE, or C in the above equation, is the reason for stronger GDP growth in Q3.
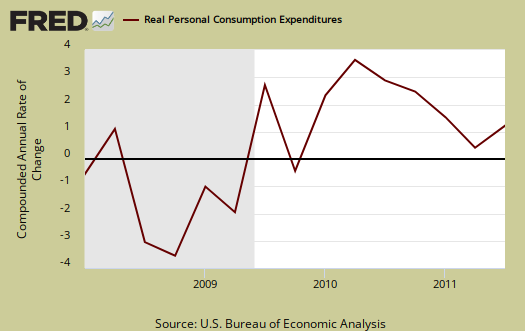
Below is the breakdown in C or real PCE annualized change. The third quarter PCE percentage point breakdown was a +1.38 percentage point contribution in services, goods was +0.35 with durable goods being most of goods, or a +0.31 percentage point contribution to GDP. Notice when times are tough, durable goods (bright red) consumption drops. Where people spent their money in Q3 was personal household expenditures, a +1.43 percentage point contribution to GDP. Health care expenditures was +0.61 percentage points of Q3 GDP. PCE is often revised from the advance report as receipts and reports are collected. Below is PCE with the breakdown of goods versus services.

Changes in private inventories subtracted –1.08 percentage points from Q3 2011 2.45% GDP. Last quarter changes in private inventories contributed a –0.28 percentage point change. The change in private inventories point contribution reduced Q3 GDP by 44%. Companies reduce inventories when they believe an economic slowdown will happen.

Below are real final sales of domestic product, or GDP - inventories change. This gives a better feel for real demand in the economy. This is the better news of this GDP release, it shows real demand increased 3.6%, versus 1.6% for Q2.

Below are net exports, or the trade deficit, in real chained dollars, for Q3 2011.

The below graph shows real imports vs. exports. Exports increased 4.0% from last quarter, in comparison to 3.6% for Q2. Q3 imports increased 1.9% versus a 1.4% change for Q2. It is the trade deficit that matters for GDP, although volume of trade implies a slower global economy. These numbers are almost always revised from the advance report as Census trade data comes in from customs.

Below are the percentage changes of Q3 2011 GDP components in comparison to Q2. Realize there is a difference between percentage change and percentage point change. Point change adds up to the total GDP percentage change and is reported above. The below is the individual quarterly percentage change, against themselves, of each component which makes up overall GDP.
- C = +2.4%
- I = +4.1%
- G = 0.0%
- X = +4.0%
- M = +1.9%
The BEA's comparisons in percentage change breakdown of 2nd quarter GDP components are below. Changes to private inventories is a component of I.
C: Real personal consumption expenditures increased 2.4 percent in the third quarter, compared with an increase of 0.7 percent in the second. Durable goods increased 4.1 percent, in contrast to a decrease of 5.3 percent. Nondurable goods increased 0.2 percent, the same increase as in the second. Services increased 3.0 percent, compared with an increase of 1.9 percent.
I: Real nonresidential fixed investment increased 16.3 percent in the third quarter, compared with an increase of 10.3 percent in the second. Nonresidential structures increased 13.3 percent, compared with an increase of 22.6 percent. Equipment and software increased 17.4 percent, compared with an increase of 6.2 percent. Real residential fixed investment increased 2.4 percent, compared with an increase of 4.2 percent.
X & M: Real exports of goods and services increased 4.0 percent in the third quarter, compared with an increase of 3.6 percent in the second. Real imports of goods and services increased 1.9 percent, compared with an increase of 1.4 percent.
G: Real federal government consumption expenditures and gross investment increased 2.0 percent in the third quarter, compared with an increase of 1.9 percent in the second. National defense increased 4.8 percent, compared with an increase of 7.0 percent. Nondefense decreased 3.7 percent, compared with a decrease of 7.6 percent. Real state and local government consumption expenditures and gross
investment decreased 1.3 percent, compared with a decrease of 2.8 percent.
Motor Vehicles added +0.07 percentage points to Q3 real GDP while computer final sales added +0.21 percentage point changes. This is different from personal consumption, or C auto & parts. Motor vehicles, computers are bought as investment, as fleets, in bulk, by the government and so forth.
Residential fixed investment added +0.05 percentage points to Q3 GDP after subtracting a paltry +0.09 percentage points in Q2. In other words, residential fixed investment is D.O.A.. Below is the raw totals on residential investment. If one could ever see the housing bubble and then it's collapse in terms of economic contributions, the below graph is it.

Private, or not from the government, nonresidential fixed investment came alive, with a 16.3% change from last quarter and a 1.54 percentage point contribution to Q3 GDP. Equipment and Software was a 1.20 percent point contribution, or a 17.4% percentage change from Q2 to Q3.

Since the GDP report is in real chained 2005 dollars, one might notice the price index used for Q3 is much less than Q2. In other words, less inflation, more real value in comparison to the previous quarter.
The price index for gross domestic purchases, which measures prices paid by U.S. residents, increased 2.0 percent in the third quarter, compared with an increase of 3.3 percent in the second. Excluding food and energy prices, the price index for gross domestic purchases increased 1.8 percent in the third quarter, compared with an increase of 2.7 percent in the second.
In current dollars, not adjusted for prices, GDP, or the U.S. output, is $15.1986 trillion, an increase of 5% from Q2. From Q1 to Q2 output increased 4.0%, or $145 billion to $15.0128 trillion. Applying the price indexes, or chained, real 2005 dollars, Q2 was $13.2718 trillion and Q3 GDP was $13.3528 trillion.
Here are the overview for the Q2 2011 GDP, 3rd revision report, unrevised.
* In Table 2, the BEA reports GDP contribution components with their equation sign. If durable goods for example, decreased over the quarter or year, it is reported as a negative number. Imports, from the GDP equation, are already a negative for that is not something produced domestically. A negative sign implies imports increased for the time period and a + sign means the change in imports decreased. Or, from the GDP equation: . Confusing but bottom line exports add to economic growth, imports subtract.
Comments
What this report means
I'm seeing major press reports acting like "all is good" economically and the "worst is over" between this GDP report and the 50% Greek debt haircut.
Far from it. We've seen other good GDP quarters, while unemployment keeps rising and there has been negative policies passed which will guarantee more job losses, one of them being more bad trade deals.
So, while this is great news in comparison to what could have been, one quarter of solid GDP growth, which is an advance report, does not mean, magically all is well.
It means it could have been much worse has now passed, i.e., double dippers look to be wrong.
Here, we didn't predict a double dip, although Q3 GDP I estimated to be more around 2%, vs. 2.5%.
Another Debt "crisis" is coming too
Along with the underlying economic headwinds get ready for more hysteria from the Republican radicals in congress. In November there has to be agreement on the latest wreck the economy spending cuts. May as well wreck consumer confidence over the holidays.
Economic Fiction
The GOP has spewed more economic fiction than I care to shake a stick at, in part due to their "primaries". They shut out Buddy Roemer who seems to be cherry pickin' on policy across the political spectrum, he must be knowing a little about what actually works to be doing that.
I just get the feeling both political parties are out to destroy the United States, period, per the demands of MNCs and other special interests. They could care less about the people who live here.