
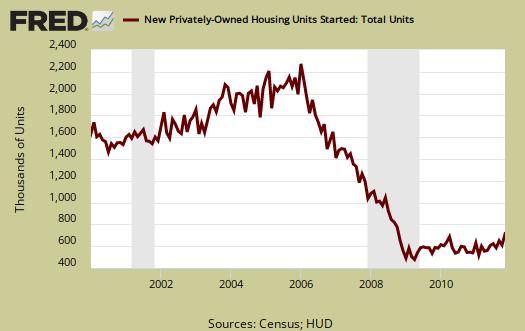
The November 2011 Residential construction report showed Housing starts surged 9.3% from October's revised 627,000, to a level of 685 000. This is +24.3% above November 2010, or 551,000 housing starts. The surge was due to apartments, 5 units or more, of one building structure.
New Residential Construction has a margin of error often above the monthly percentage increases. November, for example, has a error margin of ±13 1% percentage points on housing starts.
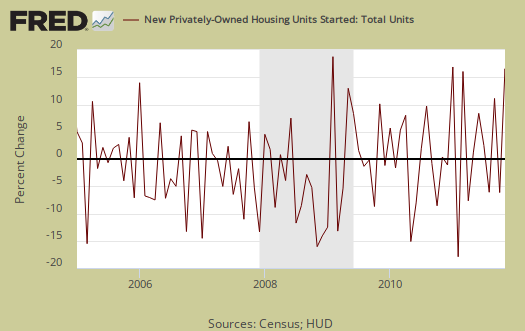
Additionally, as we see in the above graph, the monthly percentage change is quite noisy, even though this monthly economic report is seasonally adjusted. This is why it's better to look at the overall unit levels instead of the month to month percentage change.
Single family housing starts increased +2.3% from October. Single family housing is 75% of all residential housing starts.
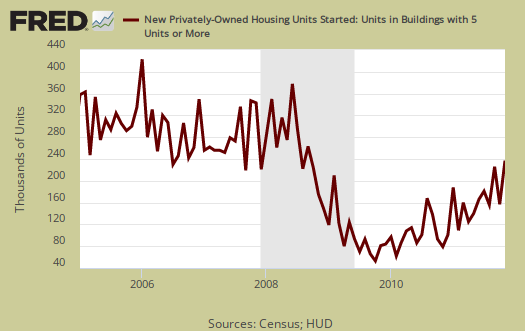
Housing of 5 or more units skyrocketed 32.2% for November and is up a whopping 180.5% for the year, clearly coming off of it's bottom. Both October and September were also revised upward.
Guess all of those people who were foreclosed on need apartments now, assuming they have any money to make rent. Although rental vacancy rates for Q3 were 9.8%, we just saw in the CPI report rents increase 0.2% and the previous month costs to rent increased 0.4%.
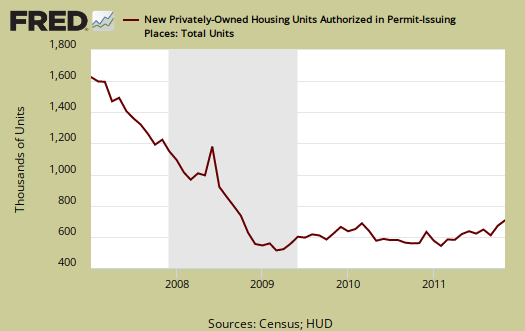
Building permits, also increased +5.7% to 681,000 and are up +20.7% from this time last year. Single family building permits increased +1.6% from October, but again 5 units or more, or apartments, condos, soared, up 32.8% in a month. Building permits have much less statistical error, ±1.6% for single family and ±6.2 for 5 units or more, than housing starts. Below is the St. Louis Federal Reserve FRED graph for Building permits. The graph shows building permits are not always a smooth line from month to month.
Housing Completions increased by +5.6% and are now up 1.6% from November 2010. This number reflects housing starts from 2010.
This report has a large variance, so to establish a trend line one must take into account months of data. This report is also seasonally adjusted and residential real estate is highly seasonal.
Some things to take away from this report is multi-family, otherwise known as rental units, are really taking off and no surprise there since the mortgage lending standards are so tight and there are so many foreclosures. A silver lining to the destruction of the American Dream.
Another point is the traditional house, single family is still D.O.A., barely making a budge. Below is the graph of single family housing starts.

I recommend Calculated Risk, the uber site on housing data, for more graphs and analysis..
Additionally the Q3 home and rental vacancy rate report, released by the Census November 2nd, has state by state data on their website.
Here is last month's new construction overview, unrevised.
Recent comments