
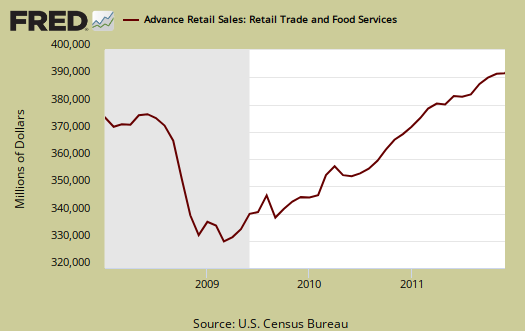
December 2011 Retail Sales increased 0.1%. Minus autos & parts retail sales dropped -0.2%. November retail sales were revised up to 0.4% from 0.2%. Retail sales are up 6.5% from the same time last year. Electronics and Appliance stores plunged -3.9% during December, the holiday season. Gas sales dropped -1.6%. Retail sales are reported by dollars, not by volume, so dropping prices often reports as a decline in sales.
Total retail sales are $400.6 billion for November. While electronics and appliances plunged -3.9% from last month, it's not the real driver of consumer spending, autos are.
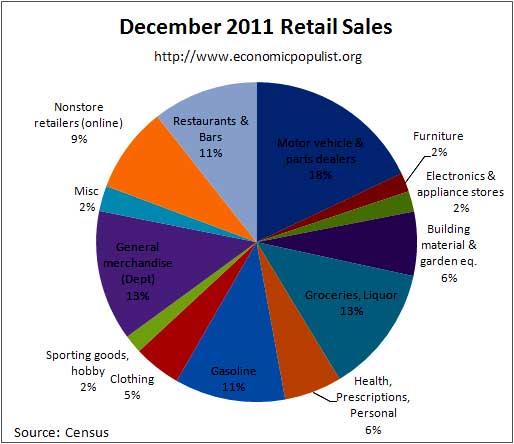
The above chart breaks down seasonally adjusted retail sales by percentage of total December sales. As we can see, electronics are only 2.1%. Computer and software store sales (which includes smartphones), are only 22% of the total store sales for the electronics & appliances category. There is a lot of hype surrounding smart phones, but sorry, smart phones do not save the economy. Below is a bar chart breaking down net sales revenues reported by surveyed stores (retail outlets).
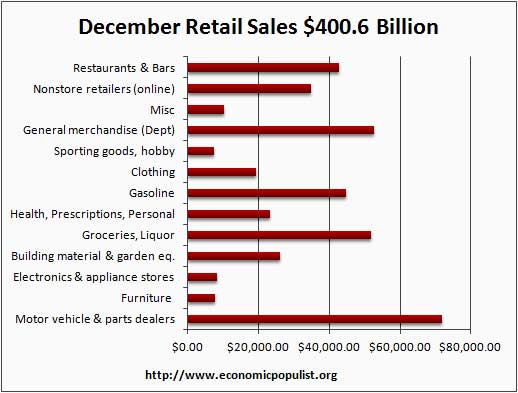
Motor Vehicles & Parts are the big money of retail sales. We spend more money on our cars than groceries and booze. Motor vehicle sales were up +1.7% in December and are up 9.5% in comparison to December 2010. Auto sales were $65.06 billion, or 16.2% of all retail sales. Motor Vehicles and Parts, or everything car retail sales increased 1.5% for December and are up 8.8% in comparison to this time last year.
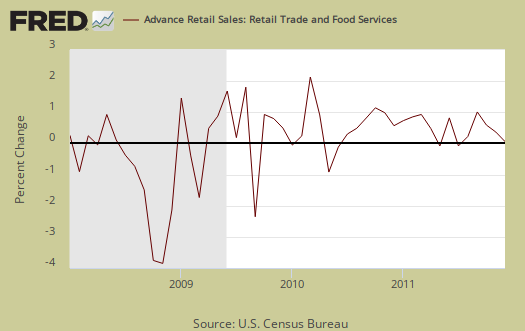
Retail sales are not adjusted for price increases, not reported in real dollars. Real Economic growth adjusts for inflation. Retail sales has variance, margins of error, and is often revised as more raw data comes into the U.S. Department of Commerce (Census division). For example, this report has an error margin of ±0.5%. Data is reported via surveys, and is net revenues of retail stores, outlets. Online retail net revenues are asked in a separate survey of large retail companies (big box marts). This is also the advanced report. To keep the gains in perspective, below is the graph of monthly percentage changes since 2008.
Gas sales decreased -1.6% from November but are still up +8.9% in comparison to December 2010. Grocery retail sales decreased -0.2% for the month and are up +4.7% from this time last year. Hard to believe with Holiday meal shopping, but there ya have it. Volume does come into play here if it increases greater than the price decreases in aggregate reported data from retailers.
Nonstore retailers decreased -0.4% but are up +10.6% from the December previous. Nonstore retailers are online shopping, mail order, door to door. Online shoppin' is roughly 76% of nonstore retail sales. It's clear e-shopping is increasing in market share and is becoming a large factor in overall retail sales.
As we can see, in spite of the many claims we had record holiday sales, the results are not materializing in the retail sales reported figures. One reason could be retailers gave such discounts while their volume increased their overall sales by gross receipts did not. Another possibility is retailers, in masse, have not turned in their surveys to the Commerce department, but this is highly unlikely.
Retail trade sales are retail sales minus food and beverage services and it flat lined, or had no change from November. Retail trade sales includes gas and are up +6.3% for the year.
Building material, garden equipment increased 1.6% this month and is up 5.8% in comparison to this month last year. Clothing was up 0.7% for the month and has increased by 6.0% in comparison to this time last year. Sporting goods, books, music, hobby retail sales increased 0.4% and are up 2.8% in comparison to December 2010. Furniture increased +1.0% and is up 5.6% from December of last year. Department stores decreased -0.2% and are down -1.0% from this time last year. We see Sears closing stores as well as Macy's, so let's just say they did not have a great Christmas.
Advanced retail sales are reported three month tallies. There is variation in the monthly reported figures as well as data reporting lag. The three month tally, from October to December, retail sales are up +1.9% from the previous three month period and +7.0% in comparison to the same period in 2010.
Seasonal adjustments are aggregate and based on events like holidays associated with shopping, i.e. the Christmas rush.
Retail sales correlates to personal consumption, which is about 70% of GDP growth. Yet GDP has inflation removed from it's numbers. This is why Wall Street jumps on these retail sales figures. Lord help them if America stops shoppin'. Half of America is poor and poverty rates are as high as 1993. Overall, wages were flat. Increases in real disposable personal income are usually low or declining. In other words, where people are getting the cash to go shoppin' appears to be on credit, or going into more debt.
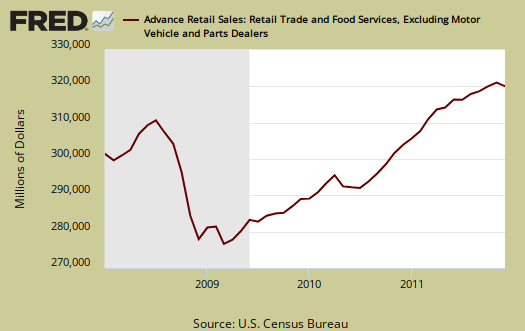
The below graph is retail sales minus autos & parts. Retail sales minus autos & parts decreased -0.2% for December and is up +6.0% since this time last year. Take away eating out, or food services, and retail sales flat lined for December. A big fat zero lump of coal after all of those promises the great American shopper saved the economy by going into more debt during Christmas.
Here is last month's overview unrevised. Advance reports almost always are revised the next month.
While Wall Street cheers and this report is useful for individual retail sectors, for better macro economic indicators the personal income & outlays report gives monthly real, or adjusted for inflation, personal consumption expenditures. Basically if prices increase, so do retail sales, even if the volume remains the same.
MarketWatch gives holiday sales tallies:
Holiday sales — defined as November and December retail sales excluding autos, gasoline, food services and non-store outlets — grew 4.1% from last year, according to calculations by IHS Global Insight.
We calculated out holiday sales percentage increase from last year and also came up with 4.05%.
IHS had projected 2011 holiday sales to increase 4.9%, mainly on price increases. The NRF projected holiday sales to grow by 3.8%.
2010 holiday sales increases, as defined by IHS Global insight were 4.4% and by the NRF were 5.2%. 2009 Holiday sales increased just 1.1% from the previous year, by the IHS Global Insight definition.
Different groups calculate out holiday sales differently and NRF include online sales, which we believe is more valid. This article gives a history on The National Retail Federation's numbers and definitions.
Regardless, anyone claiming this year was a record blow out, well, we've looked high and low and all we find are lumps of coal in the actual reports.
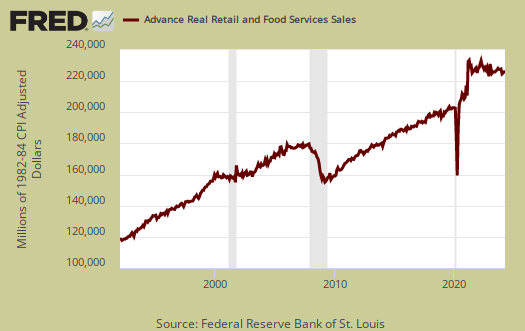
To wit, below is the graph, only going to November 2011 of retail sales in real dollars, or adjusted for inflation. We can see it's no record, we are not even back to pre-recession levels in real dollars.
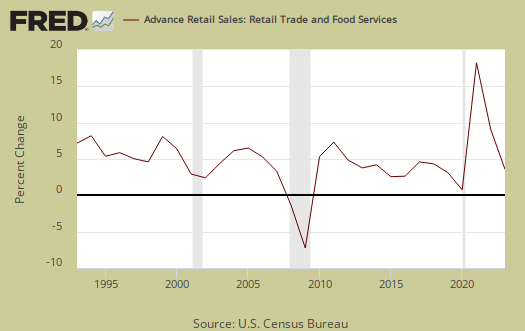
The highest in a decade headline many in the press are reporting is annual retail sales percent change growth, but not adjusted for inflation. Yippie, prices increased on food and gas. Seriously, we don't find that number anything to write home about. Not to be deprived of eye candy, below is the graph of of annual retail sales percentage change, not adjusted for inflation.
Recent comments