
Q4 GDP was revised upward again to now be 1.4%. That's double the original advance report of 0.7% and the first revision was 1.0%. The primary cause of the upward revision was more consumer spending in services than previously estimated. The trade deficit Q4 GDP impact was significantly less. Residential housing was revised upward as well. With this revision Q4 GDP still shows fairly weak economic growth, although almost double the original estimate is quite an overall revision.

As a reminder, GDP is made up of: where Y=GDP, C=Consumption, I=Investment, G=Government Spending, (X-M)=Net Exports, X=Exports, M=Imports*. GDP in this overview, unless explicitly stated otherwise, refers to real GDP. Real GDP is in chained 2009 dollars.
The below table shows the Q4 GDP component revision comparison in percentage point spread. As we can see import damage was less and the real change was in investment. Changes in private inventories is part of investment.
| Comparison of the Q4 2015 GDP Revised Components | |||
|---|---|---|---|
|
Component |
Q4 First Revision |
Q4 2nd Revision |
Spread |
| GDP | +1.00 | +1.38 | +0.38 |
| C | +1.38 | +1.66 | +0.28 |
| I | -0.12 | -0.16 | -0.04 |
| G | -0.01 | +0.02 | +0.03 |
| X | -0.34 | -0.25 | +0.09 |
| M | +0.09 | +0.11 | +0.02 |
The below table shows the comparison between Q3 GDP components and the newly revised Q4 ones.
| Comparison of Q3 2015 and Q4 2015 GDP Components | |||
|---|---|---|---|
|
Component |
Q3 2015 |
Q4 2015 |
Spread |
| GDP | +1.99 | +1.38 | -0.61 |
| C | +2.04 | +1.66 | -0.38 |
| I | -0.11 | -0.16 | -0.05 |
| G | +0.32 | +0.02 | -0.30 |
| X | +0.09 | -0.25 | -0.34 |
| M | -0.35 | +0.11 | +0.46 |
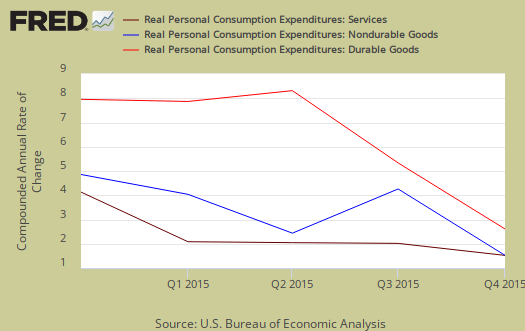
Consumer spending, C while bright spot in overall GDP really wasn't that strong in comparison to other quarters. Below is a percentage change graph in real consumer spending going back to 2005.

Goods was revised downward again to 0.36 percentage points from 0.42 percentage points and the advance report had 0.53 percentage points for goods spending. Within goods, durables contributed 0.28 percentage points. Services was revised significantly higher, from a 0.96 percentage point contribution to 1.30 percentage points. Within services, health care remained high but was revised down to 0.30 percentage points from a 0.41 percentage point contribution to Q4 GDP. Household consumption was revised from 0.83 percentage points to 1.10 percentage points. Within Household Consumption Expenditures, Recreation services was previously 0.13 percentage points and now was revised to 0.35 percentage points. Graphed below is PCE with the quarterly annualized percentage change breakdown of durable goods (red or bright red), nondurable goods (blue) versus services (maroon).
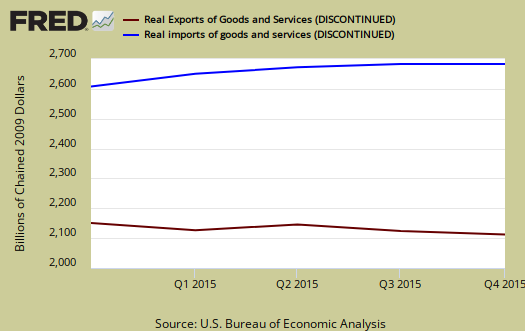
Imports and Exports, M & X net was revised again, from -0.25 percentage points to -0.14 percentage points. That is much less of a dent from the trade deficit than previously estimated. That said, exports really imploded in comparison to Q3, not a good sign for U.S. producers, although different price indexes impact total exports greatly.
Government spending, G now contributed 0.02 percentage points to Q4 GDP, which is not a significant revision. Federal spending was a 0.15 percentage point contribution while state and local spending was a -0.13 percentage points contribution.

Investment, I is made up of fixed investment and changes to private inventories. The change in private inventories alone was revised from a -0.14 percentage point contribution to -0.22. Below are the change in real private inventories and the next graph is the change in that value from the previous quarter.


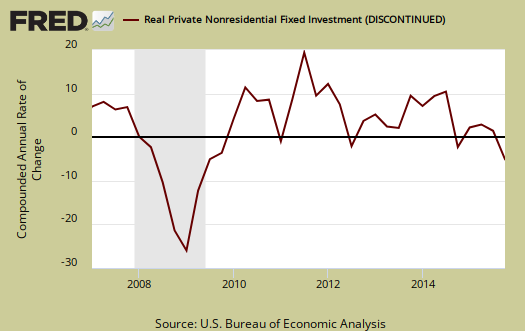
Fixed investment is residential and nonresidential and was just 0.06 percentage points of GDP contribution. Nonresidential was a -0.27 individual percentage point contribution.
Residential fixed investment was revised from 0.26 percentage points to 0.33 points of GDP. The below graph shows residential fixed investment.

Nominal GDP: In current dollars, not adjusted for prices, of the U.S. output,was $18,164.8 billion, a 2.3% annualized increase for Q3 from Q4. In Q3, current dollar GDP increased 3.3%.

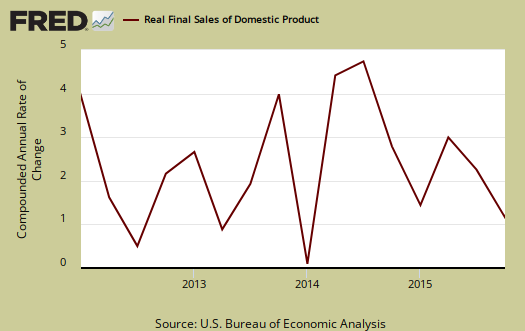
Real final sales of domestic product is GDP - inventories change. This figures gives a feel for real demand in the economy. This is because while private inventories represent economic activity, the stuff is sitting on the shelf, it's not demanded or sold. Real final sales increased 1.6% and was revised from 1.2%. Q3 real final sales of domestic product was 2.7%.
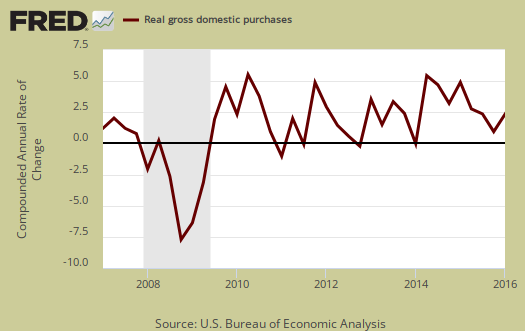
Gross domestic purchases are what U.S. consumers bought no matter whether it was made in Ohio or China. It's defined as GDP plus imports and minus exports or using our above equation: where P = Real gross domestic purchases. Real gross domestic purchases increased 1.5% in Q4, revised upward from 1.2%. Exports are subtracted off because they are not available for purchase by Americans, but imports are available for purchase in the U.S. When gross domestic purchases exceed GDP, that's actually bad news, it means America is buying imports instead of goods made domestically.
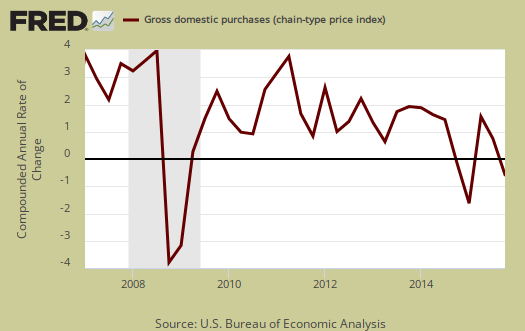
The price index for gross domestic purchases increased 0.4% for Q4. Without food and energy considered, the core price index increased 1.0%. In Q3 the price index was 1.3% for both the overall and without food and energy considered. These figures were the same in the previous revision. Below is the price index for gross domestic purchases.
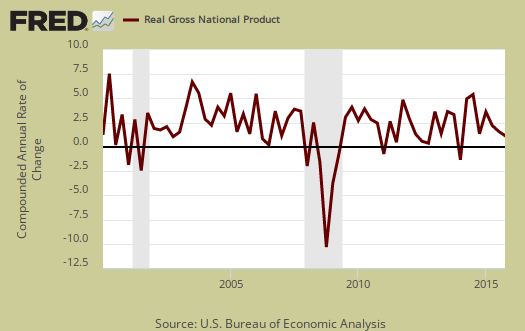
GNP - Gross National Product: Real gross national product, GNP, is the goods and services produced by the labor and property supplied by U.S. residents.
GNP = GDP + (Income receipts from the rest of the world) - (Income payments to the rest of the world)
Real GNP increased 1.1% for Q4. In Q3 GNP increased 1.3%. GNP includes, whereas GDP excludes, net income from the rest of the world. GNP increases beyond GDP if Americans made out like bandits from foreign investments more than foreigners cashed in on investments within the U.S. borders.
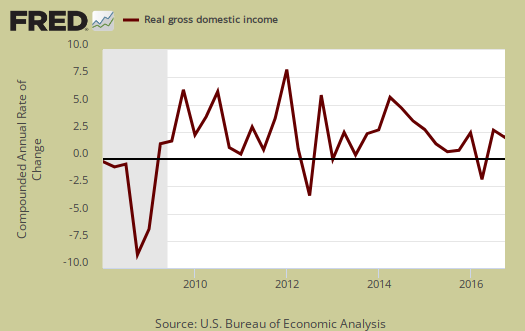
GDI - Gross Domestic Income: Gross Domestic Income is all income from within the borders of a nation and should normally equal GDP. GDI is wages, profits & taxes minus subsidies. Real GDI was 0.9% in Q4. Q3 GDI was a 2.0% increase. The BEA says GDI measures the economic output as the costs incurred as well as incomes earned in the production of GDP. The BEA also states GDI can have statistical discrepancy over short time periods, yet this is a fairly far spread by GDP and might show things are weaker than GDP indicates.
Below are the percentage changes of the Q4 2015 GDP components, from Q3. The thing to notice is how exports improved for Q2. There is a difference between percentage change and percentage point change. Point change adds up to the total GDP percentage change and is reported above. The below is the individual quarterly percentage change, against themselves, of each component which makes up overall GDP. The advance report showed investment changed -2.5% as changes in private inventories were significantly revised the last Q4 release. Additionally these changes are seasonally adjusted and reported by the BEA in annualized format.
|
Q4 2015 GDP Component Percentage Change (annualized) |
|||
|---|---|---|---|
| Component | Percentage Change from Q3 | ||
| GDP | +1.4% | ||
| C | +2.4% | ||
| I | -1.0% | ||
| G | +0.1% | ||
| X | -2.0% | ||
| M | -0.7% | ||
This GDP report revision implies a very sluggish economy vs. a slowing one. Most bizarre is how recreation services spending helped save the GDP day this revision. One can thank less demand for oil as well helping GDP by trade deficit reduction, but trust us, China is still blowing the United States out of the water on that score. Don't let the revision mask the comparison to Q3 and upcoming Q1. In spite of the high revision Q4 GDP is still very sluggish growth.
Other overviews on gross domestic product can be found here. The BEA GDP site is here.
Recent comments