
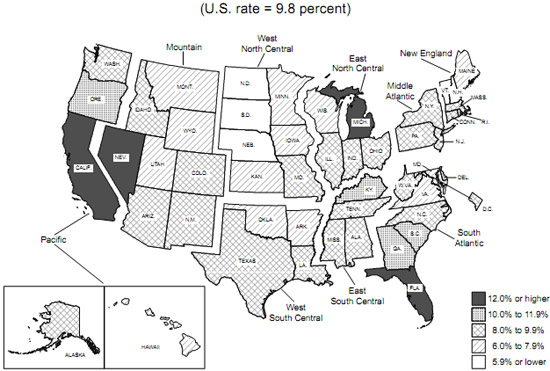
The Regional and State Unemployment figures were released today. The unemployment rates are basically unchanged in dimension. 21 states had unemployment rate increases, 15 the unemployment rate decreased and 14 stayed the same. D.C. increased. Below is the BLS map of state unemployment rates.
As we know the official unemployment rate does not a job make. Looking at actual payrolls is important indicator. 28 states had payroll employment decreases. Two states were unchanged, 20 states had payroll jobs increase along with the District of Columbia. Below is the BLS map for the percentage change in actual payroll employment over the last year. Notice how many states, in the dark, are negative for the actual number of jobs.
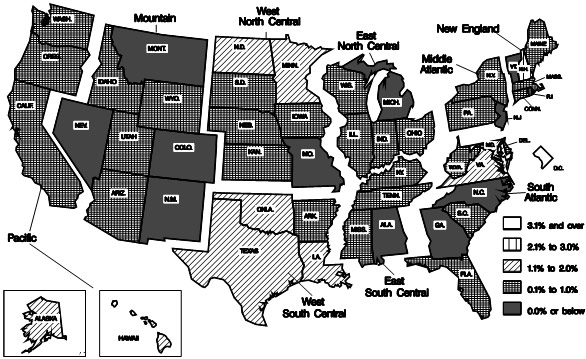
The largest over-the-month employment decreases were in North Carolina (-12,500), Massachusetts (-8,600), and Ohio (-7,800). The largest over-the-month percentage decreases in employment occurred in New Mexico (-0.5 percent) and Nevada, Utah, and Wyoming (-0.4 percent each). The largest over-the-month increases in employment occurred in Texas (+19,100) and New Jersey (+10,000). The largest over-the-month percentage increases in employment were in Alaska (+1.6 percent), Oregon (+0.4 percent), and Mississippi and New Jersey (+0.3 percent each).
Nothing budged and the West still has the highest unemployment rates. In a month, North Carolina lost -12,500 jobs. Oregon gained +6,300 jobs. In terms of the year over year, the number of jobs created is minimal, with Texas leading with 192,100 job gains for the year. Bear in mind Texas has a large population. The next largest yearly job gain was Pennsylvania, with 57,000. This is for an entire year.
In other words, we have no real job growth and people are falling off the count. Some states, Nevada, California, Michigan and Florida, are clearly disasters, with unemployment rates above 12%. Notice how these states have not created jobs. Even Rhode Island's unemployment rate is 11.6%.
If one looks over the tables, a significant number of states also had manufacturing job losses in November. This report simply does not drill down into the details enough to really understand what's going on here in more detail, especially on population, demographics. (although the raw data is available).
more state charts
The Saint Louis FRED database has individual state charts on unemployment and a few per sector (such as manufacturing in Detroit and Construction in California). If you're looking for more details on one of the 51 state, D.C. employment statistics, that's a good place to start, for they have already created the graphs from the data for you.
Actual unemployment rate for CA at present
I don't need to know who has been looking for jobs in the last 4 weeks, but rather the actual rate of the unemployed people in CA. at present
CA unemployment rate
Because there are 50 states, plus D.C., I just gave links on where to look up state data.
The official unemployment rate of CA is 12.4%, with the LA area being 12.9%. Bear in mind the BLS often counts illegals in these numbers. The CPS doesn't determine immigration status, which is also a real problem in high tech, due to guest worker Visas.
There are some occupational area graphs from California in the St. Louis FRED database, here. If that's not enough info, you must dig out the specific tables for CA and make up graphs.
During the holidays when economic news turns to a trickle, I plan on looking deeper into a lot of unemployment statistics, especially for the 2010 Census will be out this Tuesday, with assuredly tons of new data to examine.
Make a request and I'll see what I can dig up for you. CA was heavily negatively impacted in construction jobs.
I might just wade into the political charged ethnicity demographic data, in spite of the blow back that will surely follow, regardless of findings.
Not Looking Good
Florida unemployment rate is right in line with California -- don't think we have as many illegals as CA. Tampa Bay area is above state average, as is LA. Another consideration is the age structure -- Florida has about 18% of its population 65 and over, thus more retired. If we didn't have SS and UI, it would be a repeat of the great depression. Property taxes 2009 to 2010 in Tampa Bay area seemed to be flat, but 2011 may be down (reflecting softness of real estate). Raising sales tax depends on voter approval -- good luck with that. Florida has no state income tax, and getting one passed would take a constitutional amendament on the ballot -- good luck with that one as well. This is getting to be a tale of two Americas.
Frank T.
illegals/states
I'm almost being ridiculous in refusing to really examine the data on what is going on with illegals on these metrics. The reason is it's just a political charged topic, anything, even just data collection, gets a few name calls and such.
A huge problem is the BLS and the government databases just do not collect on immigration status. So, you can get "Hispanic", but that's everybody, lumped all together. You cannot tell if someone is Cuban, from Spain, from Mexico, from Chile and if they are a U.S. citizen, a legal resident or illegal.
They also lump in foreign guest workers, on various Visas in these numbers and those numbers are in the millions of foreign workers. Where that can really skew numbers is when you get down to occupational categories and those unemployment statistics.
That said, I find it interesting that the states with the most "sanctuary" policies, who refuse to really even enforce any immigration law or even IDs, demanding legitimate IDs one would be called a racist xenophobe, also seem to have some of the worst statistics economically. Michigan I'm not sure about, but both CA and FL have high illegal populations, so do NY and NJ. IL is notorious.
My attitude towards this stuff are numbers are numbers and labor economics are labor economics. You have to be dead to not realize Population growth and immigration affect all of these unemployment and jobs statistics and yes folks, the labor economics 101 laws still apply.
There is no way to address these issues in some sane, practical manner with the way the politics are. I mean Mexico right now looks worse than Iraq and Afghanistan in terms of a particularly vile war zone and it barely even gets a mention in the main stream press.
In terms of unemployment rates, official, all of those not officially looking for a job are put in the "not in the labor force" pool, so all of the FL retires aren't biasing the count.
The Feds need to consider new taxes, namely a Wall Street transaction tax and a VAT and probably some sort of alternative tax to target executive excessive compensation. A VAT is extremely regressive, but it can be used as a tool for trade imbalances. So, if they rebate it to make it more Progressive, it could really help with trade and it's quite dynamic too, easily adjusted. The, they need some sort of transaction tax to deal with these flash traders, those using engineering architectures to make bucks on stock/market trades....
it's increasingly becoming a rigged gambling house instead of an investment vehicle.
Then, the obvious is we need a super rich major tax and I think targeting executive compensation, based on some scale on how many U.S. jobs that company had in a year, what they gave back to the nation, i.e. a tax directly on executives and also directly tied to what they did for America in addition for their shareholders. They could also reform executive compensation, it's sorely needed.
Retirees and labor force
One assumes that self-report is used rather than whether they are 65+. Many 65+ can be seen working at Wal Mart, grocery baggers, local shops, self-employed, etc. I don't know whether the numbers are significant but may be offset by 62+ retirees. Anyone living on SS alone would seem to be SOL.
Frank T.
that's true but....
IF you go to the BLS website, you can find data on those over 65 as well as considered "not in the labor force", and do calculations from there.
I did some of them in this post.
Since FL has a disproportionate number of people over the age of 65, you can probably get to the state data and do something similar.
It isn't exact, you will have people over the age of 65 who need and cannot find a job in there, but it whittles down the numbers.