
The May 2011 monthly unemployment figures show the official unemployment rate increased to 9.1% and the total jobs gained were 54,000. Total private jobs came in at 83,000 with government jobs dropping -29,000.
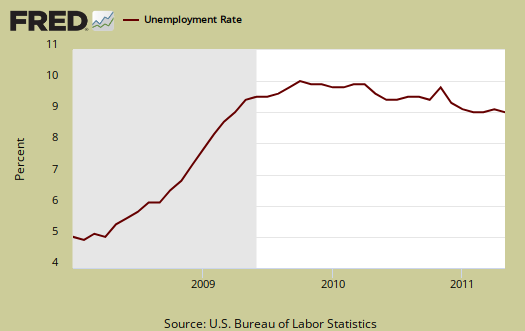
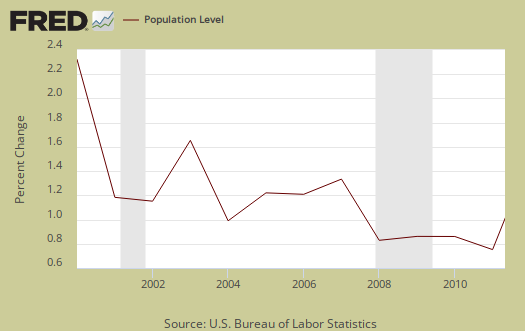
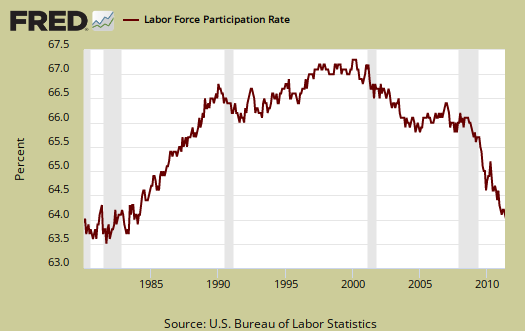
Those entering not in the labor force dropped by -105,000. The labor force participation rate was unchanged, 64.2%, the same as the previous four months. This is the lowest labor participation rate since March 1984.
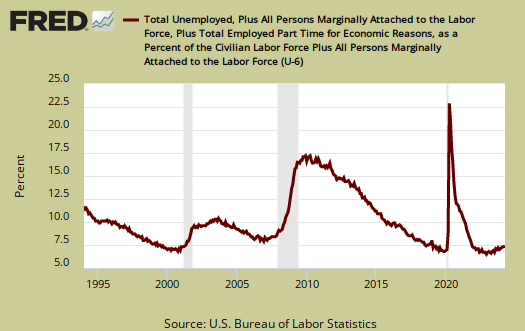
Those added to the civilian labor force were +272,000. The noncivilian population increased by +167,000. What happened here is more people were counted in the unemployment statistics than last month. U6, or the broader unemployment measurement, decreased 0.1% to 15.8%, which correlates to U-3, of the official unemployment rate. But since there are few jobs, this must be due to people falling off of the count.
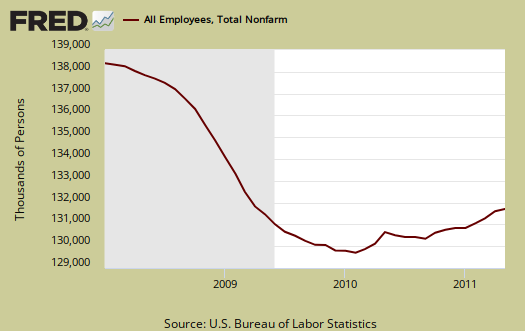
Below is the nonfarm payroll, the total number of jobs, seasonally adjusted. Since the start of the great recession, declared by the NBER to be December 2007, the United States has officially lost 6.94 million jobs. That does not take into account additional jobs needed to employ the United States increased population, but does include the jobs added over the over 3.42 years, or 41 month time period.
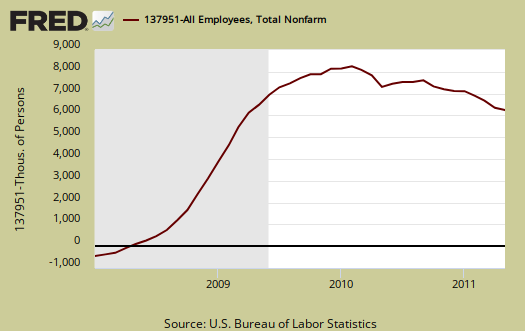
Below is a running tally of how many official jobs permanently lost since the official start of this past recession (recall the private NBER has declared the recession over!). This is a horrific tally and notice this isn't taking into account increased population growth, which implies the United States needs to create at least 10.27 million jobs or self-employment. This estimate assume a 62.7% civilian non-institutional population to employment ratio, as it was in December 2007, which implies an additional 3.33 million jobs needed over a 3.41 month time period.
We get a new graph of the alternative unemployment measurement, U-6, posted below. Here you can see the incredible increase in comparison to the beginning of this broader unemployment measurement.
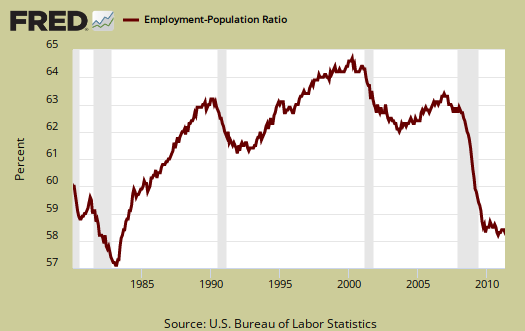
How can the unemployment rate increase? The official unemployed increased by 167,000, alternatively the employed increased +105,000. The actual labor force grew by 272,000. The employment to population ratio did not change, 58.4%. So, we had more unemployed people entering the labor force than employed, which increases the unemployment rate.
You may notice these numbers exceed the actual number of jobs created, 54,000, by the BLS. The BLS has two different surveys, two different methods, and additionally is counting other types of work beyond payroll. These numbers are from the household survey whereas the actual job count is from the establishment survey.
Below is an annualized graph of civilian institutional population. It's from this superset of people that potential workers come from.
The civilian labor force increased by +272,000, while the civilian population increased by +167,000. Yet those not in the labor force decreased by -105,000. This means more people entered the labor force looking for work. People re-entering the labor force only increased by 58,000, yet new entrants declined by -115,000. So, these numbers are a little confusing, considering the dramatic uptick in initial unemployment claims.
The civilian non-institutional population are those 16 years or older not locked up somewhere or not in the military or so sick and disabled they are in a nursing home and so on.

The increasingly low labor participation rate is now at 64.2%. If we go back to December 2007, the labor participation rate was 66%. The highest civilian labor participation rate was in January 2000, at 67.3%. What this means is there are over 4.3 million people not be accounted for in the official unemployment rate who probably need a job and can't find one and no, they are not all baby boomers retiring.
The employment to population ratio is now 58.4% which is at record lows. This isn't a structural change, such as all families decided to have a stay at home caretaker, or magically a host of people could retire early, this is people dropping out of the count. They need a job, but stopped looking, fell off of the rolls, stop being counted.
These numbers are important because unemployment is a ratio, percentage or during a limited time period, the number of people actively looking for a job and counted. Many people are not counted in the official unemployment statistics, due to definitions, but obviously when one has more potential workers and less jobs, that metric doesn't bode well for America.
Below is the graph of the civilian non-institutional population, which is the largest super-set of the potential labor force, larger than the civilian workforce, due to those who are not looking for work, retired and so on being counted in this figure. This is why one must create jobs greater than the constant rate of jobs lost. There are more people to employ. Unemployment is a percentage, a ratio.
The BLS unemployment report counts foreign temporary guest workers as well as illegal immigrants in their U.S. labor force statistics.

One needs at least 98,000 and some estimate up to 375,000 permanent full time jobs, added each month just to keep pace with U.S. civilian workforce population growth. That's not general population, that's the group needing a job.
This unemployment report doesn't even give enough jobs to keep up with population growth. It's so dismal maybe now, politicians will realize we have a jobs crisis going on for over 41 months!
AP gets it wrong....again
Last month fewer people were looking for work, this month it increased. That does not negate the fact that more people are not counted as evident by the lame labor participation rate. AP needs to pay some people who know what they are talking about in analyzing government economic reports. They completely blew it on the January one and are again. They don't seem to grasp all things are derived from the civilian non-institutional population either.
Robert I have a question
Yet those not in the labor force decreased by -105,000. This means more people entered the labor force looking for work. We see this reflected in the uptick in initial unemployment claims.
I don't get how initial unemployment claims go up because of people entering the labor force? I can't seem to grasp it. An initial claim is someone laid off or lost a job right?
it is, initial claims are those filing for UI, initially
So, it's kind of a poorly worded paragraph, sorry. It's more it can go up because there are simply more people to choose from for jobs. Hires and fires happen every day, but the rate goes up when there are more people being counted, participating than jobs.
So, more people were participating and additionally more people were being fired, because there was an uptick in filings. I don't think magically a bunch of people who were fired, waited a while and then filed for UI or anything, more it's indirect, increased supply.
I should move that paragraph to separate out the two.
corrected
I added some info about new entrants, re-entrants vs. increases in population too. I went through more in the new post, but to me, it didn't quite add up yet. I hate the fact we have three different employment reports in so many words, because they often "do not jive", three different metrics.