
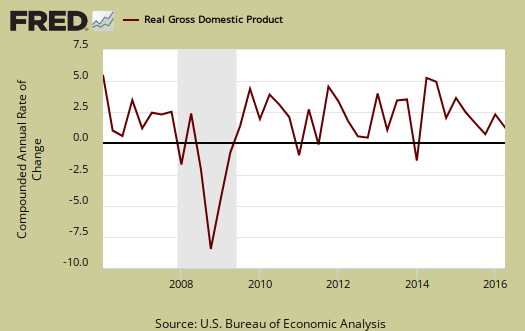
The first Q2 GDP estimate shows a surprising sputtering 1.2% of economic growth. That is a much weaker second quarter than most expected as investment declined -9.7% from the first quarter and the price index was much higher. Worse, GDP was revised for 2016 Q1 back to 0.8%. GDP for years 2015, 2014 and 2013, were all revised higher. Yet since Q2 2015, quarterly GDP was revised lower, showing quite the sluggish slowdown going on for at least a year. The revised annual GDP figures are now 2012: 2.2%, 2013: 1.7%, 2014: 2.4% and 2015: 2.6%. The below graph shows economic growth has been anemic since Q2 2015.
As a reminder, GDP is made up of: where Y=GDP, C=Consumption, I=Investment, G=Government Spending, (X-M)=Net Exports, X=Exports, M=Imports*. GDP in this overview, unless explicitly stated otherwise, refers to real GDP. Real GDP is in chained 2009 dollars.
The below table shows the GDP component comparison in percentage point spread from 2016 Q1 to 2016 Q2. There are always two revisions after the initial quarterly GDP report release. This will happen in spite of the annual revisions going back three years of GDP.
| Comparison of Q1 2016 and Q2 2016 GDP Components | |||
|---|---|---|---|
|
Component |
Q1 2016 |
Q2 2016 |
Spread |
| GDP | +0.83 | +1.21 | +0.38 |
| C | +1.11 | +2.83 | +1.72 |
| I | –0.56 | –1.68 | -1.12 |
| G | +0.28 | –0.16 | -0.44 |
| X | –0.09 | +0.16 | +0.25 |
| M | +0.09 | +0.06 | -0.03 |
Consumer spending, C was clearly the bright spot for Q2. With a 2.83 percentage point increase, that is the largest contribution to GDP since Q4 2014. Below is a percentage change graph in real consumer spending going back to 2000.

The breakdown of consumer spending was spread fairly evenly across categories. Goods spending was 1.45 percentage points. Durables was 0.60 percentage points by themselves. Services was a 1.38 percentage point contribution. Within services, health care was a 0.44 percentage point contribution to Q2 GDP, whereas housing and utilities was 0.52 percentage points. The never ending contribution to economic growth of people spending their hard earned dollars on health care is really disconcerting. Graphed below is PCE with the quarterly annualized percentage change breakdown of durable goods (red or bright red), nondurable goods (blue) versus services (maroon).

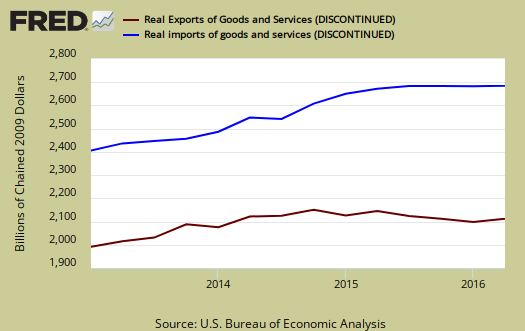
Imports and Exports, M & X show a surprisingly positive 0.23 percent point contribution. This is the advance GDP estimate, hence actual trade data hasn't come in yet and imports are almost always revised upward, even with petroleum imports declining as a trend. We expect this to be revised to be a drag on GDP.
Government spending, G contributed -0.16 percentage points to Q2 GDP with e state and local governments subtracting -0.14 percentage points.

Investment, I is made up of fixed investment and changes to private inventories and this is where disaster struck for Q2 GDP. Overall gross investment was a -1.68 percentage point drag on GDP. The change in private inventories alone was a -1.16 percentage point contribution. The changes in private inventories have subtracted from economic growth for five quarters in a row. This is a bad sign for the economy as businesses reduce their inventory stockpiles due to too much on hand for the businesses to use. Below are the change in real private inventories and the next graph is the change in that value from the previous quarter.


Within overall investment, fixed investment is residential and nonresidential. Here too things were not good with over half a percentage point, -0.52, negative GDP contribution. Nonresidential was a -0.28 individual percentage point contribution. Within nonresidential, structures subtracted -0.22 percentage points from GDP and equipment was shorn by -0.21 GDP percentage points. Equipment's percentage point GDP contribution has been negative or zero for six quarters.

Residential fixed investment wasn't this quarter's saviour as it subtracted -0.24 percentage points to GDP. The below graph shows residential fixed investment.

Nominal GDP: In current dollars, not adjusted for prices, of the U.S. output,was $18,437.6 billion, a 3.5% annualized increase for Q2 from Q1. This is quite an inflation adjustment for this quarter. In Q2, current dollar GDP increased 1.3%, showing Q1's growth was stunted regardless of inflation figures.

Real final sales of domestic product is GDP - inventories change. This figures gives a feel for real demand in the economy. This is because while private inventories represent economic activity, the stuff is sitting on the shelf, it's not demanded or sold. Real final sales increased 2.4%, which is mediocre but also shows how inventories are quite the drag on the second quarter economy.

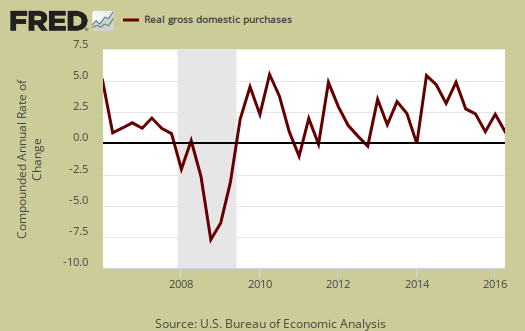
Gross domestic purchases are what U.S. consumers bought no matter whether it was made in Ohio or China. It's defined as GDP plus imports and minus exports or using our above equation: where P = Real gross domestic purchases. Real gross domestic purchases increased 1.0% in Q2. Exports are subtracted off because they are not available for purchase by Americans, but imports are available for purchase in the U.S. When gross domestic purchases exceed GDP, that's actually bad news, it means America is buying imports instead of goods made domestically.
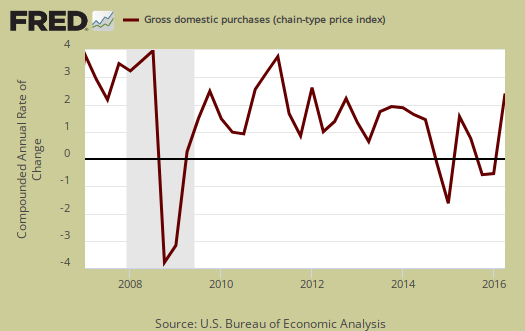
The price index for gross domestic purchases increased 2.0% for Q2. The price index is similar to CPI and is an inflation measure. Price indexes are used to deflate raw GDP into real GDP, or what the value would be with price increases for the same activity removed. Q2's price index is quite high in comparison to Q1's 0.2% increase Without food and energy considered, the core price index increased 1.7%. In Q1 the price index without food and energy considered increased 2.1%. This should add rationale to the Fed raising rates as this is around the Reserve's target inflation rate. Below is the price index for gross domestic purchases.
Below are the percentage changes of the Q2 2016 GDP components, from Q1. There is a difference between percentage change and percentage point change. Point change adds up to the total GDP percentage change and is reported above. The below is the individual quarterly percentage change, against themselves, of each component which makes up overall GDP. Additionally these changes are seasonally adjusted and reported by the BEA in annualized format. Durable goods by themselves showed a 8.4% increase. Within investment structures showed a -7.9% drop. Residential investment showed a -6.1% quarterly decline.
|
Q2 2016 GDP Component Percentage Change (annualized) |
|||
|---|---|---|---|
| Component | Percentage Change from 2016 Q1 | ||
| GDP | +1.2% | ||
| C | +4.2% | ||
| I | -9.7% | ||
| G | +0.9% | ||
| X | +1.4% | ||
| M | -0.4% | ||
This GDP report is really weak and implosion of investment is foreboding on further quarters. Contracting inventories for six quarters in a row is particularly unnerving. The three year benchmark revisions did not help matters as Q1 was revised backwards and the overall earlier annual increases were not by much, yet dramatized the overall slowdown since Q2 2015.
Other overviews on gross domestic product can be found here. The BEA GDP site is here.
GDP looks to be revised way down
construction spending for all three months of the 2nd quarter was lower than reported by the BEA in the advance report for 2nd quarter GDP... annualized construction spending for April was revised $9.9 billion lower, and annualized construction spending for May was revised $2.4 billion lower...in reporting 2nd quarter GDP, the BEA's technical note indicated that they had estimated June residential construction would be $3.9 billion greater than that of the previously reported May figure, and that June nonresidential construction would be $1.4 billion greater than that of the reported May figure...with this report, May residential construction spending was revised from the originally reported $451.9 billion to $445.9 billion, while May nonresidential construction spending was revised from the originally reported $407.4 billion to $410.7 billion....that means the BEA overestimated June construction spending by $8.0 billion...the annualized figure for 2nd quarter construction spending would thus be $6.8 billion less than the figure used by the BEA when computing 2nd quarter GDP, implying a .23 percentage point reduction to 2nd quarter GDP...
rjs