Two economic reports today show the deeply indebted US economy is in a decline that is likely to stretch into a recession that could be quite severe.
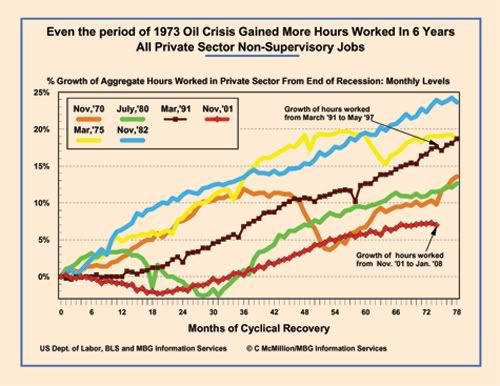
The BLS jobs report shows a loss of -17,000 jobs in January, an even sharper -0.3% loss in total hours worked and a decline in average weekly wages even before considering the effects of inflation. Annual revisions to data back to 1990 that are included in today’s report, shows the economy had -376,000 fewer jobs in December than previously estimated. Only 994,000 new jobs were created over the past year and of these, only 809,000 were created by the private sector.
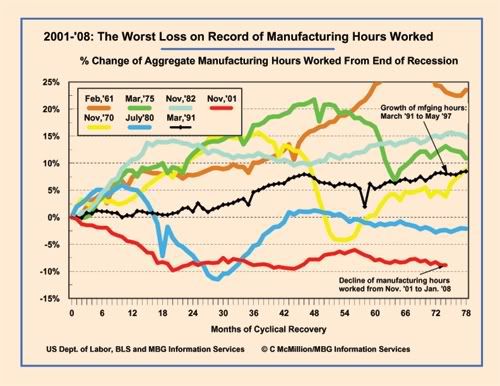
With today’s downward revisions to total paid hours worked, the current 74 month period since the end of the recession in November 2001 is, even more than before, by far the weakest comparable period on record for expanded payrolls. This includes even those periods such as the deep, double-dip “supply side” recession of the early Reagan years. Total hours paid for manufacturing jobs are now shown to be down a record -8.9% since November 2001 – even worse than in the early (foreign) “supply side” period of debt dependency when the country first began producing less than it needed and began to suffer chronic manufacturing trade deficits.


Again in January, run-away private health and education bureaucracies piled-on another 47,000 jobs with bars and restaurants adding another 15,000 jobs. These generally low wage jobs failed to offset the loss of -30,000 jobs in state/local public education, the loss of -28,000 manufacturing jobs and the loss of -27,000 construction jobs. With state and local governments now facing reduced sales, income and property tax revenues, this important recent source of job growth has been lost. (my industry-by-industry jobs table is also attached(pdf))
A Census report on Construction spending today shows that December marked the third consecutive monthly decline in the nominal value of construction put in place. Along with continued steep decline in the value of residential construction, public construction also suffered a near across-the-board decline in December offsetting the slowing growth in non-residential private construction.
Along with other recent economic indicators, today’s reports confirm the wisdom of the Federal Reserve’s recent aggressive rate cutting.
The economy appears already to be in a decline that is likely to stretch into a long and deep recession.

Comments
How Long and How Deep:Roots and Prospect for the Current Crisis
This crisis has many aspects, trade, immigration, manufacturing and currencies.
Suppose we consider the value of the dollar over the last 8 years. Let's peg the dollar vs gold.The dollar vs gold has lost 60 percent of it's value. This loss has come with the monumental expansion of the twin deficits: trade and federal budget.
If we measure the value of the dollar vs the yen or Euro, there is a similar loss of about one third. This is consistent with purchasing power erosion of the Euro over 8 years.The last times in U.S Economic history similar currency crises have occurred were 1970-1973, 1933-1934, and 1872-1874. Each of these periods involved a loss in the value and purchasing power of the U.S. dollar. Anyone familiar with U.S. history can quickly paint a picture of those times.
When the housing crisis is piled on to the currency crisis, each of the two magnifies the other. There is no way to understate the human or social tragedy of 405,00 families forcibly evicted from their homes. Just do the math: almost 5 million evictions per year. Over several years, we have the dimensions of a large domestic refugee population. The closest historical similarity to the housing crisis is the dust bowl and the housing losses
of the Civil War.