
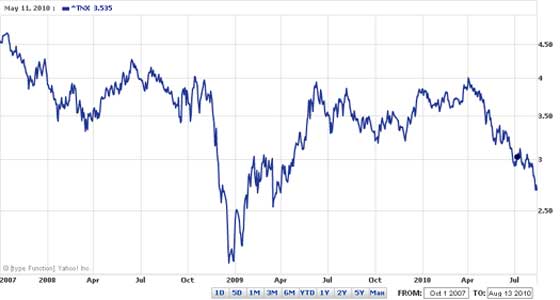
The U.S. Treasury 10 year yield curve is at new lows, but more importantly, around the values during height of the financial crisis.
U.S. Treasuries 10-Year Yield
Two-year note yields dropped to a record low as the Federal Reserve prepared to buy Treasuries tomorrow as part of its plan to spur the slowing economy by keeping borrowing costs low. The difference between yields on 2- and 10-year note yields narrowed for a third day to the flattest yield curve since April 2009.
Seeking Alpha has Treasury Note Yields since 1990 (with chart).
The speed with which the yield on the 10-Year U.S. Treasury Note dropped from just over 4.00% in early April to just 2.68% as of Friday’s close is astonishing – and points to how the bond market is evaluating the prospects for deflation, recession and a prolonged economic malaise, or worse.
This week’s chart of the week captures the history of the yield on the benchmark 10-Year U.S. Treasury Note since 1990, when it was hovering in the vicinity of 9%. For additional context I have also included a gray area chart of the S&P 500 index. More often than not, yields on the long bond are positively correlated with equities, but this relationship can decouple, sometimes for an extended period of time.
ZeroHedge has a great 3D graph of US Treasuries since 1990.
This is what the Wall Street Journal blog said about Zero Hedge's graph:
It gives you as good sense of not just the movements of rates, but also how the Fed has been able to sit on the short end of the curve in an attempt to drive investors out into riskier assets.
China in the meantime has dumped the most U.S. Treasuries ever:
China cut its holdings of US Treasury notes and bonds by the most ever, raising speculation a plunge in US yields has made government securities unattractive.
The nation's holdings of long-term Treasuries fell in June for the first time in 15 months, dropping by $US21.2 billion to $US839.7 billion ($940 billion), a US government report showed yesterday. Two-year yields headed for a fifth monthly decline in August, falling today to a record 0.48 per cent.
Regardless, we has mentioned many times, much of the financial crisis was really pushed under the rug, delayed. No policy or legislation has changed much the status quo, so experiencing déjà vu is to be expected.
The Bigger Point is History of Yield
These yields are far below the yields of the 1932 - 3.4 v 2.7 for 10 year.
But then we have an equally bad credit crunch.
BTW I would publish my name if I thought my comments would not be censored.
censored
I don't know who you are and I'm not too big on chasing down people's real identities either.
Censoring on EP has to be direct personal attacks, posting complete Economic Fiction or threat of site sabotage will get someone into trouble (i.e. trying to delete a host of posts or something to that effect).
For example, posting a lobbyist white paper that is a bunch of spun up numbers that one needs to dig deep to see it's complete spin, the stats are not real, is a favorite activity of lobbyists and one reason they get the big bucks.
So, posting one of their papers and claiming it's fact is an EP no no.
there is more info in the FAQ and forum.
That is one amazing stat.