
The January 2011 monthly unemployment figures are out. The official unemployment rate decreased to 9.0% and the total jobs gained were 36,000. Total private jobs came in at +50,000, in stark contrast to the 187,000 ADP reported for January. You might ask how the unemployment rate could drop when there were not enough jobs added to even handle U.S. population growth? This month is funky. The BLS changed population ratios, an annual revision, but as a result makes month to month change comparisons invalid. Why is explained below.

The BLS did two major adjustments, the first being yearly revisions to nonfarm payrolls, or the actual number of jobs and the second being to population. For The entire year of 2010, nonfarm payrolls were adjusted downward by -215,000. Now this is the CES survey, which extrapolates the total number of jobs from direct survey data. Here are the details of the CES survey, from the BLS:
BLS collects these data each month from the payroll records of a sample of nonagricultural business establishments. The sample includes about 140,000 businesses and government agencies representing approximately 410,000 worksites and is drawn from a sampling frame of roughly 8.9 million unemployment insurance tax accounts.
So, in terms of counting the actual number of jobs created in January, we can assume these are reasonably valid, in spite of an annual revision from the previous months of -215,000 in total nonfarm payroll jobs.
The population adjustments are where things get weird. This is the CPS survey, which is a sampling of 60,000 households, then that data is extrapolated to total population. In turn those CPS metrics are ratios, based on assumed population growth. Now, even though the 2010 Census data is out, the BLS is basing population changes from the 2000 Census and, won't be modifying the Household survey data for the unemployment report with 2010 Census data....until 2012.
The actual population totals were updated by the Census in terms of actual growth projections....but....that is running from a Census 2000 baseline, not 2010. To add to that, these adjustments affect all previous months, not just December and January, even though the adjustment occurs between the December to January in the data. Get that? In other words you have a glitch in the data progression timeline, so comparing December to January includes that glitch or adjustment, even though that adjustment represents months of cumulative population data errors going backwards over time. Therefore, one cannot compare the change from December to January in these months for total CPS amount changes and have it be valid. That change from December to January includes the glitch or the adjustment number. The Unemployment Rate is a Ratio and all things are derived from the estimated United States population. Here are the adjustments listed by the Census:
The adjustment decreased the estimated size of the civilian noninstitutional population in December by 347,000, the civilian labor force by 504,000, and employment by 472,000
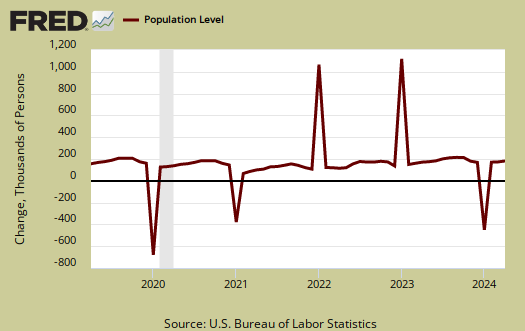
Below is an example of the glitch from the civilian non-institutional population. The graph represents the percent change, monthly. Notice how the increase is pretty much 200,000, except once yearly, from December to January, where you get those huge changes. That's our yearly population adjustment, or glitch, or data discontinuity.
So, with that, let's look at what we know is valid in trying to compare January 2011 to December 2010.
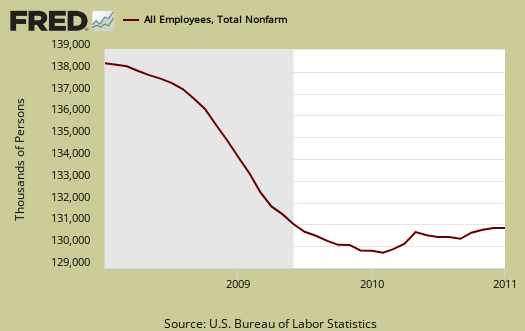
Below is the nonfarm payroll, the total number of jobs, seasonally adjusted. Since the start of the great recession, declared by the NBER to be December 2007, the United States has officially lost 7.731 million jobs. This is with the new adjustments from past months for nonfarm payrolls.
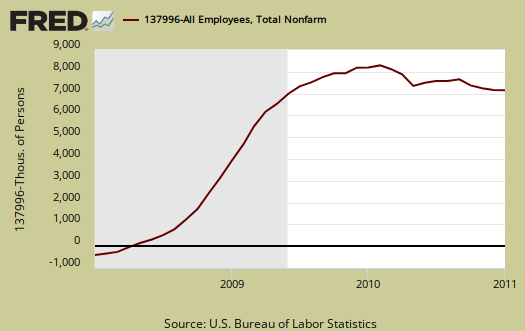
Below is a running tally of how many official jobs permanently lost since the January 2008, 1 month after the official start of the past recession (recall the private NBER has declared the recession over!). This is a horrific tally and notice this isn't taking into account increased population growth from December 2007.
How can the unemployment rate decrease so dramatically when not enough jobs were added to even cover population growth? Here is where those population adjustments kick in, so we can only give the current ratios for any sort of data validity.
The civilian labor force was 153,186,000 and the new civilian population for January is now 238,704,000. Of those still in the civilian labor force, employed, was 139,000,00, yet those unemployed was 13,863,000. Those not in the labor force was 85,000,000. The employment to population ratio is 58.4%.
The civilian non-institutional population are those 16 years or older not locked up somewhere or not in the military or so sick and disabled they are in a nursing home and so on. Not in the labor force are those of the civilian non-institutional population who are not counted as looking for work or having a job. The BLS gave us a handy chart to show the change as reported and what the change would have been in the third column, if the population adjustments were removed from the January reported CPS numbers, so one could compare Apples to Apples, the fruit being December 2010 to January 2011. Still, although the fruit is now the same in the below chart, it's still poison.
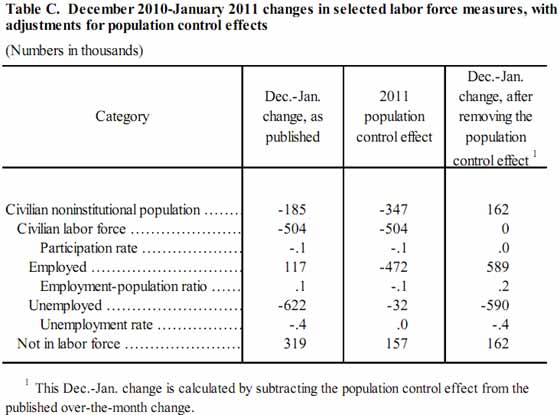
Now you say, ok, where did the the 589,000 employed people come from if you take away the population adjustments? Well, frankly they didn't come from anywhere, remember the CPS survey is extrapolated, so because the overall population is lower and now adjusted, those 589,000 are imaginary people now, based on faulty overall population numbers. Weird huh?
What this tells us is to focus on the CES survey this month, which also was adjusted and maybe write your Congress rep that in this day and age of geolocation, GPS, gee wiz Google knows more about me than my Mother does, maybe, just maybe we could get updated methodologies to calculate the real number of people in this country each month since it's such a critical number upon which so many other ratios are based.
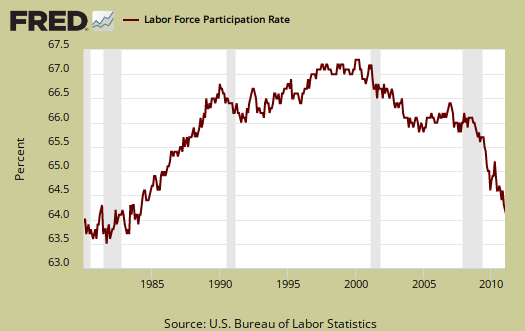
Some ratios we can look at are current rates. For example, the civilian labor participation rate is still horrific.
What about the unemployment rate? Well, the problem here is how many people are really dropping out of the labor force, not to be counted, which is another metric dependent upon overall population.
We'll have more details on the January unemployment report in another post. For now, one can assuredly say the United States did not, as usual, create enough jobs.
spelled out more clearly, no stick figures though
You cannot compare not in the labor force from December 2010 to January 2011, that number is invalid due to the one time yearly noninstitional civilian population adjustment that represents 12 months or more of data errors.
You cannot compare employed or unemployed from December 2010 to January 2011 due to the above reason. From the BLS chart, you can see, all is derived from the noninstitional civilian population number. Therefore, totals that are not rates include the population adjustment and dramatically skew the numbers between these two months.
I know this is very confusing and as implied in the above post, this is absurd to only put in a population adjustment representing 12 months or more in the last month's data point, it should at minimum be adjusted by month and at maximum, well, first, they need more than 60k households, 2nd, they need to update to 2010 faster, 3rd, instead of this decade long antiquated Census run, they need an alternative measure introduced that can estimate population changes per month on data from a variety of other sources...finally they plain need to include immigration status! I believe Congress, not the BLS, controls the purse strings, minimum for new raw data collection methods on population.
key graph and fictional employed
I'm reading around the Internets and I still don't think a lot of people really get this. The key is that noninstitional population graph, that is percent change on a month to month basis. So, when you see a flat line across there, it means the change is a constant, or in this case around 200,000 population growth per month in those 16 or over, not locked up or in the military or in some nursing home or hospital.
So, what you see in those deep spikes down, are the yearly adjustment, but that is an anomaly, because that deep spike down in the graph is the adjustment, but that number does not represent an adjustment between December 2010 to January 2011, it represents an adjustment in population growth going back throughout 2010 and all the way to 2006.
So, all things are derived from this number, including who is employed, so you might look at the adjustment in employment, also really an adjustment in the population growth. Those are not real people, really counted, that's extrapolated from a baseline 60k survey and it's extrapolated to the baseline noninstitional population size and the the rate of those employed versus those not with a job.
This is why the claiming there was an increase in 589,000 employed people in the population is fiction, because these numbers in the CPS survey are all derived off of that baseline noninstitional civilian population number.
sampling error, more BLS information
The BLS publishes much more in depth information on their CPS survey and the sampling error. I don't want to get into standard deviations and methods, plus starting out with a bias that is cumulative and all of that statistics rot, but there is one bunch of numbers which are pretty useful. This is from the BLS reliability of CPS estimates, p. 195.
The sampling error, error range by one std. deviation for monthly change amounts are:
That means 68% of the intervals, if you add or subtract these monthly amounts, you'd hit the "true" population subset levels. If you take these numbers and multiply by 1.645, you'd get 90% of the time, up or down, the true levels.
This is why beyond updating as quickly as possible, the 2010 Census data base, to be used (noted in this post), I think they need to increase their sample size to try to reduce the std. deviation size.
These sampling levels are above, often, or are greater than the actual monthly change reported. In other words, the consecutive monthly change from September 2010 to October 2010 of the unemployed was 76,000, which is less than one std. deviation of 172,000, or inside the confidence interval.
Also, this analysis came from the BLS, which will exist for any sample, a std. deviation measurement. They wouldn't be publishing their std. deviations and accuracy, diffusion indexes, if they were just out to get cha and lie. Numbers people don't do that, this stuff is hard to get dead on and yet another reason I'd like to see a larger sampling with an alternative modern communications data gathering method added.