
The S&P/Case-Shiller Home Price indexes for December 2010 were released today with a headline that prices are near the Q1 2009 low point. The National index is down -3.9% for Q4 and down -4.1% in comparison to Q4 2009.

The above graph shows the composite-10 and composite-20 city home prices indexes. Prices are normalized to the year 2000, so the index value of 150 means single family housing prices have appreciated, or increased 50% since 2000 in that particular region. The composite-10 index is down -1.2% annually and the composite-20 index decreased -2.4% for the year. For the November to December percentage change, the composite-10 index is -0.9% lower and the composite-20 is -1.0%.
Below is the yearly percent change in the composite-10 and composite-20 Case-Shiller Indices. As you can see, there is clearly a new decline going on for 2010. This is what is meant by double-dip in declining home prices.

The National Index is within a percentage point of the low it set in the first quarter of 2009. Despite improvements in the overall economy, housing continues to drift lower and weaker.” says David M. Blitzer, Chairman of the Index Committee at Standard & Poor's.
“Unlike the 2006 to 2009 period when all cities saw prices move together, we see some differing stories around the country. California is doing better with gains from their low points in Los Angeles, San Diego and San Francisco. At the other end is the Sun Belt – Las Vegas, Miami, Phoenix and Tampa. All four made new lows in December. Also seeing renewed weakness are some cities that were among the last to
reach their peaks including Atlanta, Charlotte, Portland OR and Seattle, where new lows were also seen. Dallas, which peaked late, has so far stayed above its low marked in February 2009.”“The 10- and 20-City Composite indices remain above their spring 2009 lows; however, 11 markets – Atlanta, Charlotte, Chicago, Detroit, Las Vegas, Miami, New York, Phoenix, Portland (OR), Seattle and Tampa – hit their lowest levels since home prices peaked in 2006 and 2007. We have seen more markets hit new lows in each of the past three months.”
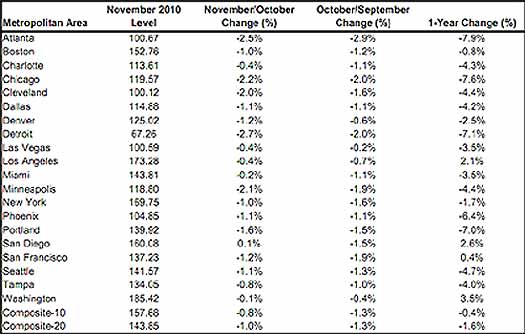
Below is a table are all of the cities of the composite-20 index. This should give a feel for the bubble and now current devaluations. Notice the stronger correlations in price declines to the unemployment rate for 2010, such as Detroit.
In Q1 2009, home prices dropped 18.9%. Now any increase from the Q1 2009 lows have eroded. The housing prices double dip is clearly in progress, as reported by S&P for the last two months.
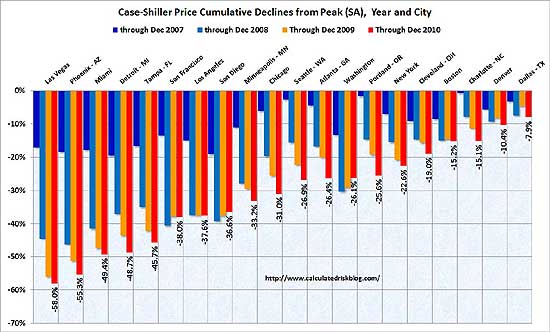
The graph below, from Calculated Risk, shows how much prices have fallen from their peaks in the Composite-10 cities. Calculated Risk has additional custom graphs and data analysis and is the uber site for residential housing data and graphs.
S&P does a great job of making the Case-Shiller data and details available for further information and analysis on their website.
home prices, real levels at year 2000
If you're tracking housing data, sales at all, Calculated Risk has a must read post on how the NAR is misreporting their housing data.
Real means adjusted for inflation, what's the real increase, after taking inflation into account. So Calculated Risk adjusted for inflation and came up with this astounding result.
So, this means that all profits, investments from housing for the last decade are wiped out. That....is astounding.
So much for the great ownership society, which just masked the great job excodus to China and India.