
The September 2011 ISM Manufacturing Survey increased 1.0 percentage points to 51.6%. This is a pleasant surprise. While a 51.6% PMI isn't anything to write home about, it is an increase and indicates manufacturing expansion. Below is the manufacturing composite index, PMI, still around 2008 levels.

New Orders had zero change from last month and is just on the side of contraction, 49.6%. This is the 3rd month in a row for new orders to be contracting.
A New Orders Index above 52.1%, over time, is generally consistent with an increase in the Census Bureau's real series on manufacturing orders

You maybe wondering how PMI could increase when new orders is in contraction and flatlined. It was the backlog of orders where production grew. Manufacturer's order backlog dropped -4.5 percentage points to 41.5%. This is actually not a good sign for future manufacturing growth. Sure production increased, but it appears due to manufacturers wiping out their order backlogs, where new orders are in contraction.
From the report the manufacturing sub-sectors who are reporting a drop on order backlogs:
The three industries reporting increased order backlogs in September are: Wood Products; Miscellaneous Manufacturing; and Fabricated Metal Products. The 10 industries reporting decreases in order backlogs during September — listed in order — are: Primary Metals; Apparel, Leather & Allied Products; Computer & Electronic Products; Furniture & Related Products; Electrical Equipment, Appliances & Components; Nonmetallic Mineral Products; Machinery; Chemical Products; Paper Products; and Transportation Equipment.

Production, which is the current we're makin' stuff now meter, increased +2.6 percentage points from last month to 51.2% and moved from contraction to expansion. Production correlates to the Federal Reserve's industrial production, where the September figures will be out mid-October.

Below is the ISM table data, reprinted, for a quick view. It shows Economic Armageddon has been postponed, sorry to disappoint you.
| MANUFACTURING AT A GLANCE SEPTEMBER 2011 | ||||||
|---|---|---|---|---|---|---|
| Index | September | August | % Point Chg. | Direction | Rate | Trend |
| PMI | 51.6 | 50.6 | +1.0 | Growing | Faster | 26 |
| New Orders | 49.6 | 49.6 | 0.0 | Contracting | Same | 3 |
| Production | 51.2 | 48.6 | +2.6 | Growing | From Contacting | 1 |
| Employment | 53.8 | 51.8 | +2.0 | Growing | Faster | 24 |
| Supplier Deliveries | 51.4 | 50.6 | +0.8 | Slowing | Faster | 28 |
| Inventories | 52.0 | 52.3 | -0.3 | Growing | Slower | 2 |
| Customers' Inventories | 49.0 | 46.5 | +2.5 | Too Low | Slower | 30 |
| Prices | 56.0 | 55.5 | +0.5 | Increasing | Faster | 27 |
| Backlog of Orders | 41.5 | 46.0 | -4.5 | Contracting | Faster | 4 |
| Exports | 53.5 | 50.5 | +3.0 | Growing | Faster | 27 |
| Imports | 54.5 | 55.5 | -1.0 | Growing | Slower | 25 |
| OVERALL ECONOMY | Growing | Slower | 28 | |||
| Manufacturing Sector | Growing | Slower | 26 | |||
Now we come to employment. Where are the damn jobs? The manufacturing ISM employment index increased +2.0 percentage points to 53.8%. The neutral point for hiring vs. firing is 50.1%.
Below are the BLS manufacturing non-farm payrolls (jobs) for the past decade on the left (September's numbers are out Friday), graphed against the ISM manufacturing employment index on the right. The BLS number is simply raw manufacturing jobs tally, not taking into account population growth or overall sector shrinkage as well as time lag. One can eyeball a slight correlation in the middle of the decade, yet note the divergence this recovery, starting late 2008.

Inventories decreased -0.3 percentage points to 52.0%. In Q2 GDP changes in private inventories contracted and took off 0.28 percentage points from 1.3% Q2 GDP. Manufacturing's customer inventories also increased 2.5 percentage points to 49.0%.

Exports new orders popped up +3.0 percentage points to 53.5%. This is in stark contrast to other nations' PMIs, which imply a global slowing of trade. The Wall Street Journal runs a flash chart listing PMI by countries to show the global manufacturing slowdown.

Import decreased -1.0 percentage points to 54.5%. These are materials manufacturers use to make their products.
Prices increased +0.5 percentage points to 56.0% and is the 5th consecutive month prices have been below 80 since December 2010, although still above 50 and the ISM reports this is the 27th month for that. Prices are what manufacturers pay to make their products.

In terms of which industries are officially contracting, the ISM lists 6: Primary Metals; Textile Mills; Furniture & Related Products; Fabricated Metal Products; Paper Products; and Electrical Equipment, Appliances & Components.
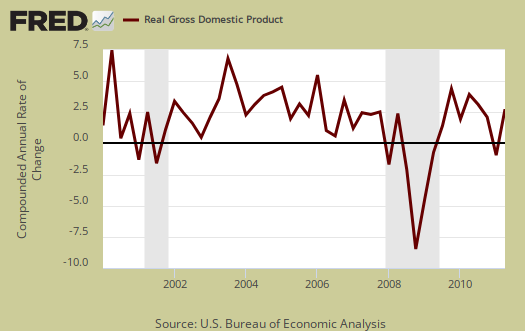
The ISM has a correlation formula to annualized GDP, but they are now noting the past correlation, versus current, probably due to the 0.04% Q1 and 1.3% Q2 GDP growth for 2011. Annualizing Septembers's data, the ISM get a 3.2% 2011 annual GDP.
The ISM neutral point is 50. Above is growth, below is contraction, although the ISM is this report is noting some variance in the individual indexes. For example, A PMI above 42, over time, also indicates growth.
Last month PMI was 50.6%. The graphs, not text, should also have any revisions.
The ISM has much more data, tables and analysis on their website. For more graphs, see St. Louis Federal Reserve Fred database and graphing system.
Armageddon postponed again
"Economic Armageddon has been postponed," -- Robert Oak
What, again? Just when it was getting good!
Labor is having Economic Armageddon
But Economic Armageddon for labor, Americans have been going strong starting in 2000. That said, this report isn't as great as it seems because new orders had zero increase.