
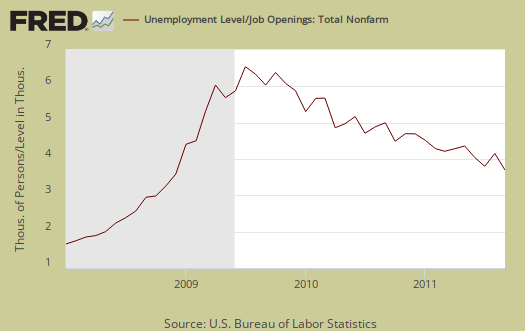
JOLTS stands for Job Openings and Labor Turnover Survey. The September 2011 statistics show there were 4.17 official unemployed people hunting for a job to every position available. There were 3,354,000 job openings for September 2011, a increase of 7.19%, from the previous month of 3,129,000. For the 38th month, JOLTS again reflects a dismal jobs market and this is with job openings increasing 38% from their June 2009 trough. August JOLTS was revised to account for the Verizon strike. Below is the graph of number of official unemployed, 13.992 million, per job opening for September 2011.
If one takes the official broader definition of unemployment, or U-6, in September at 16.5%, the ratio becomes 7.68* unemployed people per each job opening for August. Below is the graph of number of unemployed, using the broader U-6 unemployment definition, per job opening.
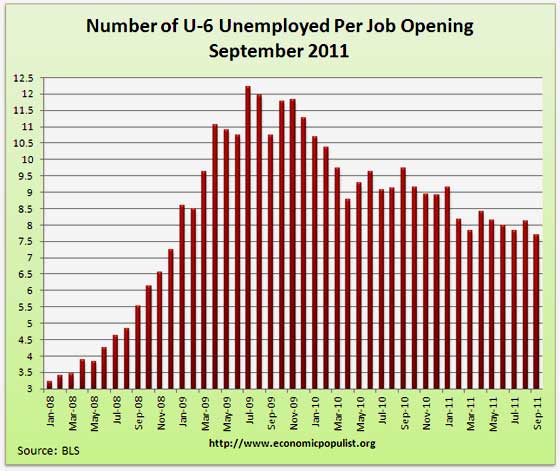
If you do not like the use of U-6 to look at the real number of people looking for a job to actual opportunities, consider this number. In September 2011, of those not in the labor force, 6,241,000 were actually wanting a job. U-6 only includes 2,511,000 of this number.
The rates below mean the number of openings, hires, fires percentage of the total employment. Openings are added to the total employment for it's ratio.
- openings rate - 2.5%
- hires rate - 3.2%
- separations rate - 3.2%
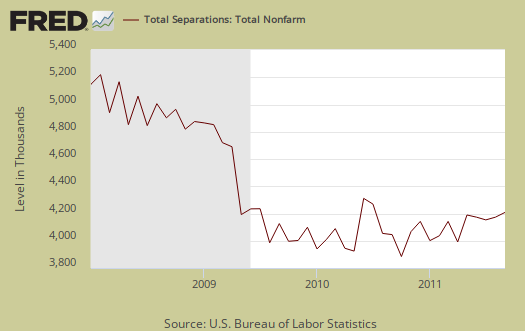
Below are raw job openings, way below the 4.4 million pre-recession levels.
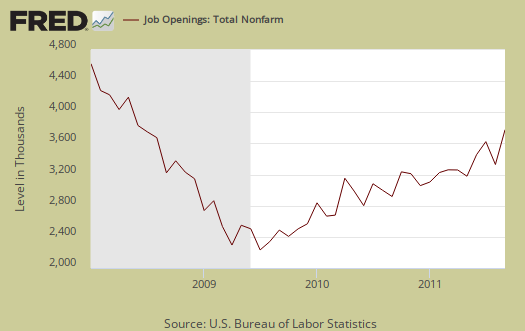
Believe this or not, one month past the so called end of the Great Recession, July 2009, job openings have increased by 1,242,000. July 2009 was the low point of job openings, 2,112,000. Consider the 14 million unemployed when looking at these numbers. In March 2007, a few months before the start of the recession (December, 2007), the number of job openings was 4,755,000.
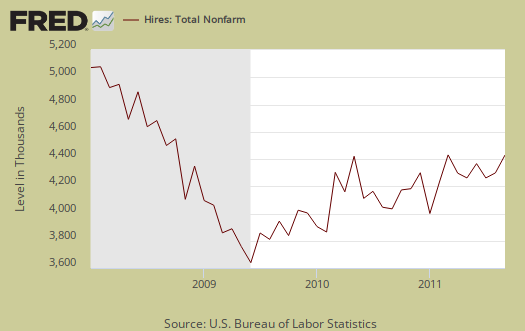
September hires were 4,245,000, an increase of 4.56% from August.
Below are total job separations, 4,149,000, a 4.78% increase from last month. The term separation means you're out of a job through a firing, layoff, quitting or retirement. The report has a breakdown of separations by occupation category and professional business services had a 14.8% increase in separations from last month.
The number of quits or voluntary job separations are still too close for comfort to the number of fires & layoffs, although improved from a year ago, where the two were 46% and 45% respectively. For September, of total separations, the quits were 49% whereas layoffs and fires were 42%, where the percent difference between the two shrank 1% from last month. Government is clearly shredding workers for the quits were 40% of the total separations while the layoffs & fires were 41%.
Below are quits minus discharges and layoffs. When quits comes close to firings that means people have little choice in employment. You want to see choice, or quits, rise and be much higher than firings. The below graph shows people still do not have many options when it comes to a job, although nowhere near the 2009 mass firings and layoffs.

The JOLTS takes a random sampling of 16,000 businesses and derives their numbers from that. The survey also uses the CES, or current employment statistics, not the household survey as their base benchmark, although ratios are coming from the household survey, which gives the tally of unemployed.
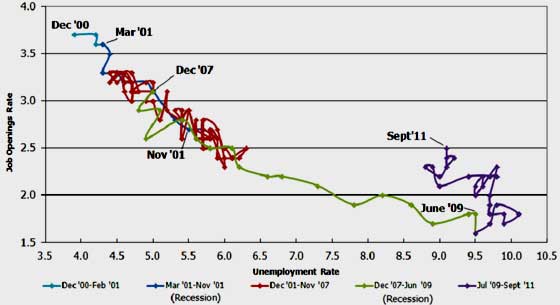
The BLS was kind enough to make a credible Beveridge Curve graph, reprinted below. The Beveridge curve shows the official unemployment rate vs. the job openings rate, over time. If you see a bunch of data points to the far right, that's bad, it means there is long term unemployment and not enough jobs. Look at how we're stuck to the right. September 2011 moved vertical up. That means there are more vacancies but it didn't dent the unemployment rate (i.e. hires). Watch out, this can indicate a skills mismatch, but from other reports, odds are employers are being absurd, expecting superman, in their requirements to hire. The green, representing the 2009 time period, shows how fast we went to the right and the purple, which is 2010, 2011, means we are stuck there. All of that purple line is the last two years and shows the U.S. worker is stuck and stuffed. Look at how awesome 2000 was for landing a job.
Additionally, JOLTS includes part-time jobs and does not make a distinction between part-time, full-time openings The September unemployment report showed a dramatic increase, 5.03%, in people forced into part-time who need full-time work.
For the JOLTS report, the BLS creates some fairly useful graphs, some of which were reprinted here, and they have oodles of additional information in their databases, broken down by occupational area. The Saint Louis Federal Reserve also had loads of graphing tools for JOLTS. Below is a reprint of the BLS bubble graph, and the first thing to note is how health and educational employment dwarfs manufacturing. For economies of scale, we really need to see that manufacturing bubble grow and grow, it's about 11% of the total economy which is not good for a host of reasons.

The above bubble graph are job openings to hires rate. A "low bubble" on the right means people are being hired and then some for the jobs available. A "floating ball" up, but to the left means employers are being absurdly picky, which has been a huge problem for getting a job. For example, arts & leisure had a lot of job openings and they hired people to fill them unlike health & education, which left a lot of job openings unfilled.
Professional and technical services is notorious to import workers on foreign guest worker Visas, displacing Americans. Employers and headhunters, contract houses, put out fictional job openings continually, demanding perfect skill matches to the point no one on the globe has that experience, all to justify why they offshore outsource jobs. So, assume job openings are inflated in STEM, which is part of professional and business services.
* is defined as the official unemployed plus people who are in part-time jobs for economic reasons plus the marginally attached. The marginally attached,
, are officially not part of the civilian labor force,
, and also not seasonally adjusted. The above graph was created by the seasonally adjusted levels of the unemployed, part-time for economic reasons and the marginally attached. The raw U-6 totals can also be calculated by this formula:
where
less bad is not good
I cannot believe Bloomberg is proclaiming this an awesome report. Clearly they didn't see separations at all or actual hires.
BLS layoffs declined in Q3,at pre-recession levels
I'm not a fan of the BLS layoff tracker, it's a crude indicator at best, simply because corporations hide fires, and especially hide moving jobs offshore or hiring foreign guest workers to displace U.S. workers. Yes, believe this or not, you cannot get this data!
That said, the BLS released their Q3 2011 layoffs today and I'll just put it here.
So, this is some reasonably good news to at least see formal layoffs back to pre-recession levels. (Q3 2007).
Great report
You did a great job putting this report together. Indicating that the jobs reported by the BLS includes part-time jobs is important, since they don't differentiate between full and part time jobs, unfortunately. Since this is a survey, you would think they could simply ask if the job is full or part time. Keep up the great efforts.
how to request more BLS data points?
I agree and one would think asking about part time jobs wouldn't be so hard since it is a survey.
That said, we need a host of additional data points from the BLS. Frankly, we need immigration status asked on the CPS. Sorry, but "politically correct" shouldn't enter into data collection, esp. in this day and age of global labor arbitrage. It's important thing to know yet they do not collect it.
I think they need to expand the survey sizes too, plus I think they need to incorporate more easily non-civilian institutional population and not do a "yearly" Dec-Jan adjustment.
If you can believe this, to even some some aggregate information from businesses, many have forced our government, that's right our government, to sign NDAs to not release certain types of data, such as how many jobs were offshore outsourced.
Thanks for the compliment, I think in terms of information, esp. all of the graphs, the BLS group which generates this report does a fantastic job, although most of these economic reports I love to graph 'em up and translate to English, point out a few things.
The information is always available from the agencies, although sometimes one really must dig.