
The November state employment statistics show a drop in unemployment rates exceeding actual job growth. No state's unemployment rate increased for November. Only five states had no change in unemployment, 45 plus the District of Columbia showed declines. The November national unemployment rate was 7.7%. Below is the BLS map of state's unemployment rates for the month.
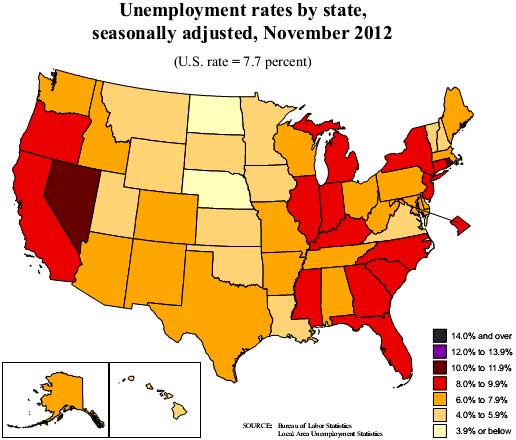
There are now only two states with unemployment rates above 10%, Nevada at 10.8% and Rhode Island, at 10.4%. California dropped below 10% for the first time since the start of the great recession jobs slaughter with a 9.8% unemployment rate. There are now just three states have unemployment rates above 9%, California just mentioned, New Jersey at 9.6% and North Carolina at 9.1%. Michigan's unemployment rate dropped to 8.9% unemployment rate, Connecticut is 8.8% and Illinois is 8.7%.
The states with the lowest unemployment rates are North Dakota at 3.1%, Nebraska at 3.7% and South Dakota with a 4.4% unemployment rate.
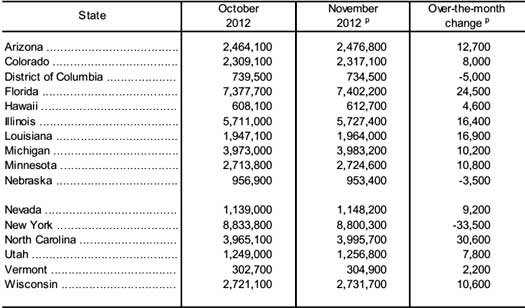
Payrolls on the other hand are not growing in ratio to the dropping unemployment rates. While jobs increased in 30 states, payrolls actually shrank in 20 plus the District of Columbia. From the report are the most significant percentage changes per state from last month in jobs.
Louisiana experienced the largest over-the-month percentage increase in employment (+0.9 percent), followed by Hawaii, Nevada, and North Carolina (+0.8 percent each). The District of Columbia experienced the largest over-the-month percentage decline in employment (-0.7 percent), followed by Nebraska and New York (-0.4 percent each).
Superstorm Sandy did show up a tad yet it's clear the BLS is not assuming the effect is all due to the storm and could be underlying economic trends.
The largest over-the-month decrease in employment occurred in New York (-33,500), followed by Indiana (-9,100) and New Jersey (-8,100).
Below is the BLS report table of the monthly significant changes in employment and the thing to notice is how small the changes are in comparison to the total payrolls of each state. California has 12% of the U.S. population and Texas is the next largest state. It's also hard to imagine all of those lost jobs in New York are due to the storm as New Jersey didn't suffer nearly as much and they were hit much harder by Superstorm Sandy.
The over the year change isn't so great either as only 29 states showed any statistically significant change and one of those states, West Virginia’s employment decreased by -13,800.
The largest over-the-year jobs increase occurred in Texas (+278,800), followed by California (+268,600) and Ohio(+100,400).
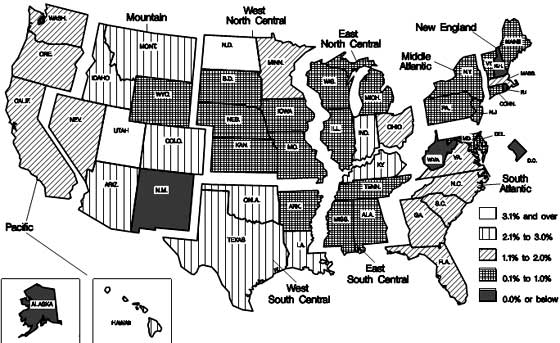
Below is the BLS map for over the year percentage change of nonfarm payrolls per state. Two states actually improved their annual payrolls for the year. North Dakota, which didn't even know a recession happened, is now joined by Utah. Ten states managed to increase jobs by 2.1% to 3.0%. Twelve states increased payrolls by 1.1% to 2.0%. We can see 21 states payrolls grew between 0.1% to 1.0% over an entire year. Five states plus the District of Columbia actually lost jobs or had no change from a year ago.
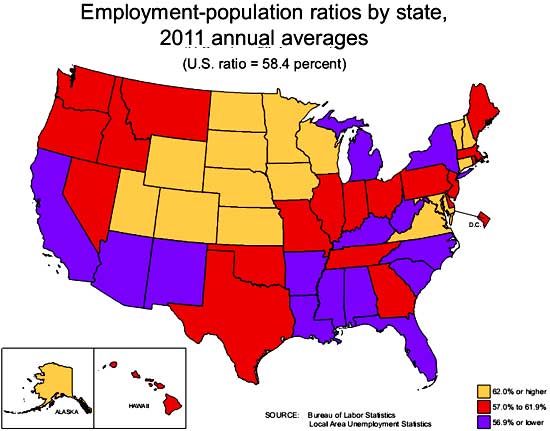
Another statistic available via tables are the civilian, non-institutionalized population to those actually employed ratios per state, tables here. Below is the BLS map for the annual 2011 population to employment ratios and Novembers's rates are here. Overall, those rates haven't changed much from the 2011 averages. One can see except really low ratios and the states in beige are the only ones with more normal percentages. What this implies is beyond the potential large populations of those in retirement, there are clearly large populations not being counted as part of the labor force who are capable of being so. In other words, in spite of the drop in official unemployment rates, in most states the job crisis is ongoing five years.
Here is last month's overview not revised. The BLS gives payrolls by state by large breakdown, such as manufacturing, so one can look up individual state data here.
Where are the freaking jobs? There are none
Not going into any analysis on anything, just mighty tired of the same bull distractions going on in DC and in the media about foreign affairs or fiscal cliffs or some fantastic war on Christmas (which I'm sure defense contractors somehow make money on) while tens of millions of fellow Americans can't catch a break. Christmas time, another new year coming, and no relief and people in power prove once again they only care about themselves. These dangerous clowns still making millions while we see no relief in sight. Why exactly are we paying them anything when we can't find paying work ourselves? They couldn't care less about what not finding a job for 2 or 3 or 5 years does to a man or woman with a family. If they thought about it and cared, they might worry just a little more about what that does to their piggybank aka American society. But that's the good thing about narcissism, it means you don't think about other people for a second. College kids, high school grads, STEM grads, law grads, teachers, small business employees, veterans, we're all screwed, and to those who think they are somehow special and have magical skills that will protect them forever, guess again - you are replaceable and will find that out as soon as you think you aren't. We should think of these politicians and oligarchs as much as they think of us, see them as much as they see us, and hold them with the same contempt they all hold us. 2013 coming, and this nightmare started in 2007 (officially). Besides UE, inflation also taking a toll. ZH had a great story a couple of days ago fully detailing the shenanigans masking true inflation that Clinton and others created to reduce the true rate years ago. Sure, you can't afford gas or food, but that's because you prefer cat food to human food and you're not really unemployed, because you don't collect unemployment and have given up looking for work because there is none. What a train wreck, and unfortunately the conductors are still alive and kicking raking in huge cash while all the passengers are dead or dying. USA 2013 - can't wait, more good times I'm sure.
The corrupt and crazy Congress
as well as this administration is just outright dangerous at this point. They are literally destroying the nation.
We'll get new 2012 averages on labor participation rates and civilian to employment population but I expect to be even worse than 2011 averages.
There are two million about to lose their meager unemployment benefits and the press doesn't even mention this.
That's two friggin' million people. That's more people than were employed over an entire year.
Sad, several years ago I
Sad, several years ago I would have said this analysis was overly pessimistic. However, I think you're right on the money.
Oh well, at least we can smoke pot in Colorado and Washington to numb the pain. Right?
this is pathetic
We have such a corrupt government the real solutions are not on the table, both parties. This suffering is generated by them.
interesting contrast...
analysis suggests that Hurricane Sandy did not substantively impact the national employment and unemployment estimates for November
I took their statment on Sandy
to imply they could not separate out the two and most interesting that NJ's payroll losses were so much less than NY as stated, but clearly we see payroll losses in the states hit by the storm. So, I'd say they simply couldn't isolate out the storm's effects.