Update 2, Nov. 7, 2008: We got three new pieces of data this week, 2 on the monetary front, and one on the inflation front.
On the monetary front, M1 was updated weekly, increasing to ~ +8% YoY. Monetary base continues to soar, up about 60% YoY now!
Meanwhile the ISM manufacturing "prices paid" index showed that more prices are declining than increasing at the producer level:
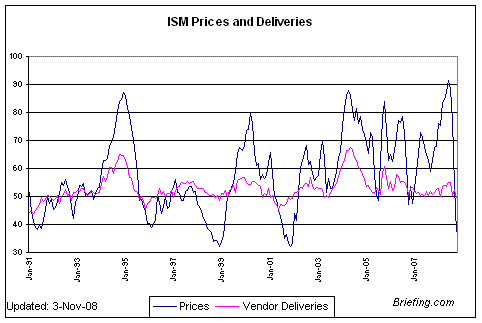
This is our first October inflation reading, and it strongly suggests we will get another month of deflation when the PPI and CPI come out in 2 weeks.
Since the updated monetary base readings continue to show elevated monetary pump priming:
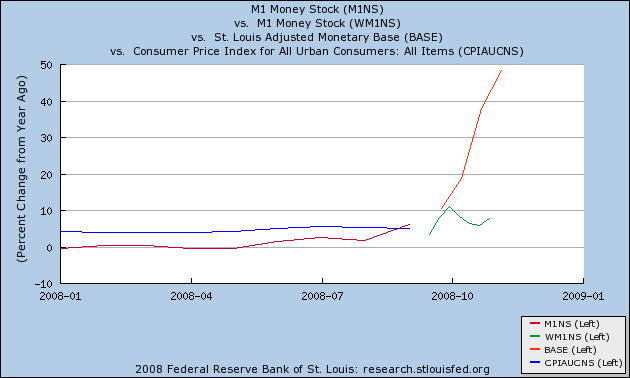
and the expectation that CPI will decline, and you get the following:
(1) more evidence that we are right now in a deflationary recession; and
(2) we will likely have 2 of the 3 months necessary to signal (under the Kasriel indicator) a respite within the next 6 months.
_______________
Update 1, Oct. 31, 2008: The only new data from the Fed is weekly M1, showing preliminary growth through Oct. 22 of ~7%:
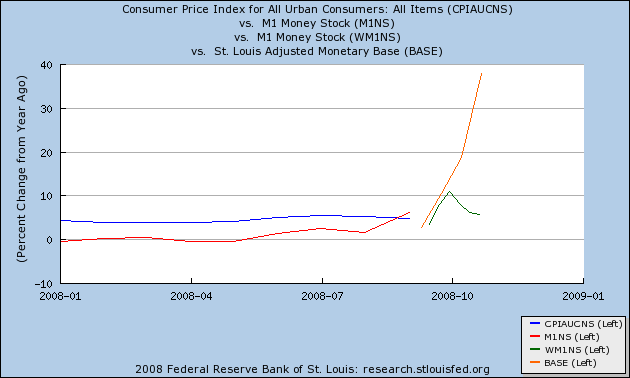
With a barrel of Oil dropping 35% from ~$100/barrel to ~$65/barrel during October, and the Chicago PMI reporting a decline in the prices paid index yesterday, most likely we will get another deflationary reading in October, dropping the Year-over-Year CPI to ~4.5%, but we won't get that number for another 2+ weeks. If that happens, it will be the second of the necessary 3 months to signal that at least a tepid recovery is about to begin. Another encouraging data point comes from Shoppertrak, which reported that for the second week, year-ver-year consumer spending was about +1%. Not stellar, but not the September collapse either. (Remember one of my theses is that consumers would overcome Bush's advice that they needed to panic, figuring Bush was wrong about that too; and while Americans do need to save more, a precipitous decline in retail spending is bad).
______________
In my previous blog entries, I have outlined two almost equally possible alternate scenarios for 2009: either a (most likely tepid) recovery, the possibility of which has begun to be telegraphed by the "Kasriel Recession Indicator" (which also has in the past 40 years perfectly forecast recoveries as well); or else a deflationary recession in which commodity and asset prices continue to decline, but are more than matched by layoffs and economic contraction.
Left to its own devices, I suspect the economy would succumb to a deflationary spiral. But Ben Bernanke and the Federal Reserve know this as well: Bernanke is a scholar of Federal Reserve mistakes during the 1929-32 Great Depression. Therefore he is aiming a veritable monetary firehose at the deflationary vortex, hoping to flood it with money and so overcome the incipient deflation.
Will he succeed? That is what I hope to track with this series of blog updates.
The two scenarios for 2009 (deflationary recession vs. expansion) are not entirely inconsistent. Consumer price deflation of (-1.5%) or greater is a coincident indicator -- it tells us what is happening in the present. The Kasriel indicator tends to lead insofar is it forecasts economic recoveries, in some cases by 6 or possibly more months. Thus a deflationary recession could be occurring now, and a recovery still occur later in 2009.
Key to both scenarios is the relationship of money supply to inflation. If there is both deflation and a decline in money supply, there has always been a recession (or worse). If money supply increases at greater than the rate of inflation (in the presence of a positive yield curve from 12 months previous, which has existed since September 2007, so we don't have to worry about that here), there has always been an expansion.
I am going to use this diary to update both scenarios as money supply and inflation data are published. Money supply (M1) is published every Friday; monetary base information is published once every two weeks; inflation data is published monthly. Keep in mind that inflation data tells us what is happening now. M1 tends to tell us what is happening now or a few months into the future; BASE tends to be even more leading for our purposes.
Here are the pictures as of Friday October 24, 2008. CPI is in blue, monthly M1 (up to 9/1/08) in red, weekly M1 (from 9/16 to 10/13/08) in green, and monetary base in orange.
First, here is a look over 10 years, showing that BASE turned up very early, even before the onset of the 2001 recession. M1 turned up midway through the recession, about 5 months before it ended. The maximum deflation was (-.9%) in October - December 2001.
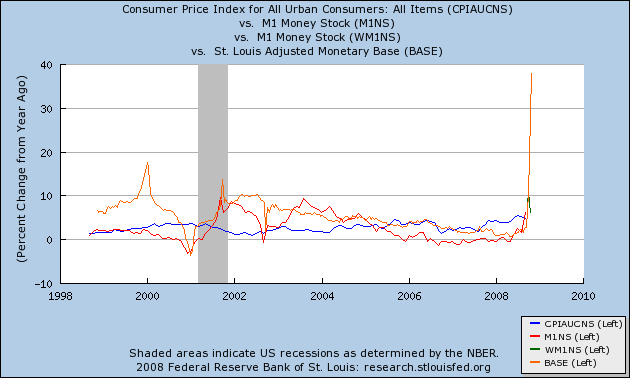
Here is a close-up just of 2008:
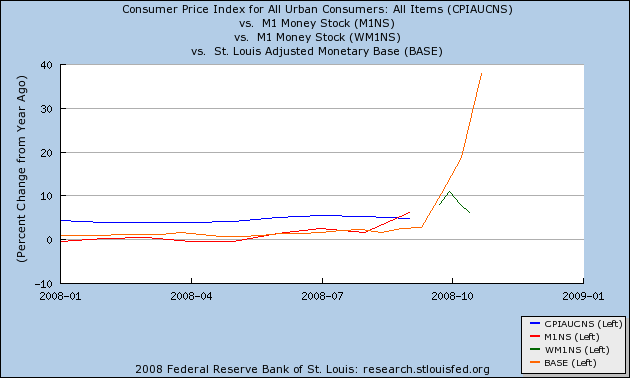
Needless to say, M1 continued its gradual expansion, finally exceeding the CPI in September 2008. The monetary base virtually exploded! Weekly M1 continues to exceed CPI. The Kasriel indicator hasn't actually been triggered yet: the positive money supply must continue for at least 3 months. As of the last CPI, there was a two month period of deflation of (-.5%), so the deflationary recession hasn't taken root yet either.
As of now, is at least possible that a recovery begins at about the time President Obama takes his oath of office.
______________________________
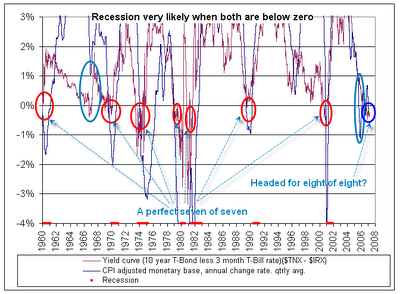
A postcript on the Kasriel indicator: In my previous post, I did not display the Kasriel indicator graphically. Here it is from Mish's blog:
When I pointed out to Mish on a recent comment at his blog that the indicator might be beginning to suggest a recovery soon, Mish took me to task, claiming that just because A > B, that does not mean that "not A" > "not B". All true, but Mish is not correct here.
Here's Mish on the infallibility of the Kasriel indicator as displayed graphically above:
Bingo! A perfect seven of seven with no misses and no false positives. The two blue-grey ovals are conditions where only one of two conditions were met.
As Mish himself noted at the time, not only does the graph show that A (Kasriel recession warning) > B (recession), but also "Not A" (no Kasriel warning) > "not B" (no recession). Therefore, once we go from A > not A, we necessarily go from B > not B -- with lead time of course. The graph appears to use rolling 3 month averages which aren't described in Mish's post, but it appears the lead time is up to 6 months for recoveries, and the recovery is always underway once both parts of the indicator are positive by 1% for 3 months.

Comments
where is the dicussion
of Mish taking you to task for there is something wrong with this logic. Not A implies not in the subset of A, therefore unknown to A and not comparable to B, even with not B.
So while ya all are touting the infallibility of the KWRI ...
during the last 40 years what other EI are within a certain bounded conditions during this framework that are not true today?
I mean Helicopter Ben with his delta function M1 increase...
that looks unprecedented to me and why is it that hyperinflation is not a possibility in your picture, delayed?
what would KRWI look like in Germany, 1920's or say the US 1930's?
When do countries have hyperinflations?
Look at Brazil in the 70's, the Confederacy in the 1860's, Weimar Germany, Argentina at the start of the current decade.
A structural imbalance in the balance of payments ... in inability to reconcile the current account and capital accounts and a consequent Red Queen's Race as money creation to chase after foreign exchange itself depresses the foreign exchange rate.
For the US, the structural dependencies are on consumer goods imports and energy imports. On consumer goods imports, as long as China has the massive growth in the labor force, its not going to kick up too much fuss about the Chinese official account deficits that allow the US to maintain a trade account deficit with China ...
... and the mess that the credit crunch is making of the supply chain in Oil markets means that the boil is off the structural imbalance in energy.
If the counter-movement to the current flow into dollars to unwind positions is a flow out again, we still might see a move toward the Euro as an international reserve currency, which would set up the pre-conditions for a hyperinflation with the US$.
It therefore is quite important whether the US makes any headway on the structural energy deficit and on the presently unsustainable current account deficit, in the next few years ... or the Teens could see that kind of hyper-inflationary melt-down.
deficits
I actually agree, I don't think the US will see hyperinflation, at least not immediately but what I most wonder is the massive deficit. Last tally was this alone has added 2.6 trillion and while the US never defaulted and ran even higher deficits in WWII, we also have a massive trade deficit.
China, who knows what they will do but they might be able to switch to a domestic economy vs. being so dependent on exports or within the Asian corridor as countries decouple from the US.
My biggest problem
Is trust.
And it isn't helped by the Chairwoman of the FDIC claiming our deposits are backed by "the full faith and credit of the United States Government". I was yelling back at the screen "Is this the same federal government who is nearly $9 trillion in debt and hasn't had a balanced budget in my lifetime?"
-------------------------------------
Maximum jobs, not maximum profits.
balanced budget
You had one under Clinton. Unless you're 8 yrs old you had one in your lifetime.
What NDD and others are trying to do is look at the theory and the mathematics, the facts, the economic indicators to see what's really going on here.
Trust is a behavioral issue.
That is under some dispute
Since the way Clinton "balanced the budget" was to borrow money from the Social Security Trust Fund, thus violating the concept of specialized funds.
My question is this- why do we trust the mathematics and economic indicators? Why do we call them facts after being lied to over and over and over? We all suspect that the government has been messing with the calculations of some of these numbers for years; the CPI for instance no longer contains food, fuel, or housing; unemployment no longer contains "discouraged" or "disabled" workers, moving millions out of the labor force just to make the numbers look better.
What makes us think that they're suddenly telling the truth now?
-------------------------------------
Maximum jobs, not maximum profits.
why breathe?
Check out shadow stats if you do not trust the stats. but look, there is something called theory, science, statistics and macro economics out there and this is the kind of thing we're looking at discussing.
Economics is not about doing some psychological trust issue, unless you want to go to the behavioral economics, which is a new, warm and fuzzy branch of the field.
This is my concern too
I just don't see deflation as much of a concern, not when there are unprecedented reflation efforts ongoing all over the world. That doesn't mean it will prevent a deep recession. It only means that both recession and inflation can happen at the same time (see 1973-1974 as an example).
Discussion not linkable nor searchable
And there was not much more to it than what I described. I followed up with a comment inviting him to prove me wrong, and he didn't respond.
His own discussion from April 2007 ("no false positives, no false negatives") means exactly what I've represented it to mean, and the graph is, I submit, self-evident. Furthermore, I have posted graphs of M1 vs. cpi, and the yield curve, in previous blog entries.
It could always "be different" this time, but the relationship holds even in the 1927-54 period.
I did not include hyper-inflation among the possibilities for 2009, because as I explained in my previous post, there is no correlation - at least absent a very substantial lag - between M1 money supply and the inflation rate. Any period of higher inflation is going to have to follow a deflationary period first. Simply put, for 2009, hyper-inlfation isn't in the cards.
M2
not M1. Can't find a graph but the tables imply it's also exploding.
Yes, I agree deflationary hell o no is possible but recovery?
As far as the locked logic, I think I just pointed to something outside the subset of the correlation between M1/CPI just as an example, which implies Mish's comment is valid but it would be nice to follow this more easily.
Of course M-2 is exploding
when the Fed bailed out these banks that got caught in CDS they took the funny money that existed as credit value in what would have been the M3 measure, and brought it on the books to the M2 measure when the Fed made loans to the banks to cover it.
Of course the Fed ended reporting of the M3 measure in 2005, I wonder why?
M2
I mentioned it because that's another one of the correlations to inflation, whereas M1 doesn't correlate.
I haven't fully fleshed this
out,
but in 2005, the Fed stopped publishing the M-3 money measure, and this is roughly the same period in which the CDS bubble was occurring. CDS contracts create "money" because they represent an agreement to make a creditor whole if the underlying asset fall.
Now the issue is that if the underlying asset is insured multiple times, that means that money is being created without any basis in terms of an expansion of the product base. In english, more money, less stuff. As the quantity of stuff to money falls, the amount of money needed to buy stuff rises. This is inflationary.
But, what if this expansion of the money supply is hidden, because there is no M-3 measure that shows the rapid growth of the money supply as these CDS contracts pile up creating values that are a multiple of the underlying asset.
Money for nothing. A massive transfer of wealth from the real economy to the financial economy conducted by way of financial instrument.
And now the measure amount of hidden money that existed in the M-3 measure is being placed back on the books as the Fed "recapitalizes" these banks. So the massive amounts of funny money that existed in the M-3 measure, but have been hidden for the past 3 years since the Fed stopped publication of the M-3 measure, are shifted onto the M-2 and M-1 measures s the Fed "launders" the bankers bad money.
interesting
I've never heard of this so I just googled it.
He even mentions CT as a reason they would do such a thing.
Have you located another "not A" argument?
more M3
I found a site devoted to tracking the money supply, inflation, deflation and is using shadowstats to figure out M3. M3.
All of it is now pointing to deflation vs. recovery but this M3, a tutorial/blog post on it would be really enlightening.
Mish's comment is not valid, period
Anyone who want to show I am wrong can do some easy searching at the St. Louis Fred site: CPI, M1, 10 year and 3 year yields (and their predecessor series) are all there and public.
To prove me wrong, all you need to do is find a consecutive 3 months' period of time where:
(1) 10 year bond yield minus 3 month bond yield over the last 12 months to the target date is a positive number
and
(2) cpi is a positive number
and
(3) M1 is a positive number greater than cpi
Yielding a result where
(1) the gdp is not a positive number
or
(2) gdp will not be a poisitive number within 6 months.
I haven't found any such time period, and I won't hold my breath that anybody else can find one, either.
Mish's comment might make sense if the potential result were something other than B/not B, e.g., where it could be B, C, or D. But here there is either negative or positive growth -- B or not B. And by his own touting, when the warning indicator has not flashed, there has been no recession. There has always been positive growth. So the only questions are whether the KRWI leads vs. is coincident or lags recoveries, as well as recessions, and if it does lead, by how much.
Again, I want to emphasize, there is only one month's data of M1 exceeding CPI, so the indicator (for recovery) hasn't been triggered yet.
I think
you are misinterpreting what he was saying, as least how I read it. This current crisis is a very different scenario, with a global financial crisis into the mix. So, you're focused in on these few economic indicators but other factors, outside of this sphere is what I took his comment to mean, not the current sphere of economic indicators you are looking at for correlations. As far as I know, during all of these past times, there never was some funky $65 trillion dollar derivatives market that could collapse or the housing bubble like this one. Maybe Japan is the best model but I did not read his comment the way you are...I read it to imply there are other factors so out of line that they will decorrelate the KWRI.
Just looking at the theory of subsets, logic is how I read his comment and was suggesting looking at other economic indicators and their levels of stability during these correlations to see if there is an overriding factor here in comparison.
The set of events includes 1929-32
Last time I checked there was a wee bit of leverage involved there too.
The yield curve inverted in 1928, and money supply and CPI went negative starting in late 1929. Finally in 1933 the CPI went positive, and M1 was positive at a higher rate. The yield curve was also positive.
From there on in until M1 and CPI went negative again late in the decade, the economy had positive GDP.
I see nothing more overwhelming in our day in comparison with 1929.
Japan
I went looking at Japan for some explanation of the "not A" argument and I couldn't find any money base graphs but I did find one article going through some theories as to why they didn't recover.
Can the Bank of Japan Create Inflation.
what do you mean nothing in our day comparing this to 1929? For the overextended credit, wage repression, deflation...
which version of the CPI is that?
Roosevelt's version, Carter's version, Reagan's version, Clinton's version, or W's version?
The CPI calculation has changed so much since 1928, I have grave doubts of it still being a predictor of anything other than administration propaganda.
-------------------------------------
Maximum jobs, not maximum profits.
But money is endogenous ...
... so the following is basically automatically true:
If there is an increase in demand for the creation of money over and above what is required to track inflation, that is demand for money to be created on the purchase of newly produced goods, and if that is happening, we are in a recovery.
Flight to safety
Has anyone actually broken down the holdings of the monetary base (M0)? While M0 does include currency in circulation it also includes money on deposit with the FED. If you look at the FED's balance sheet you'll see actual currency in circulation hasn't changed much (http://www.econbrowser.com/archives/2008/10/the_federal_res.html). One number that has is the reserve balance. The exploding M0 and recent declines in M1 (green line) could be showing a mass flight to safety and or the beginnings of a massing liquidity trap. Too bad M3 wasn't being publish because my bet is that it's hugely negative.
Yes, this is exactly on point ...
... and though M3 is not published, Broad Money is.
We have a monetary system where, in contradiction to the hydraulic analogies, the bulk of the money supply is created by actions of commercial banks that are not simple mechanical responses to Open Market Operations ...
... and where the actions of of the Open Market desk are driven by an interest rate policy, not by a quantity policy ...
... and where when a quantity-driven policy was attempted, it consistently failed to meet its goals.
So claiming to have monetary readings without rate information and Broad Money is back to the proverbial blind man feeling the tail of an elephant and saying an elephant is like a living fly-whisk.
"recent declines in M1"
Actually, the green line shows M1 expanding at a 7-8% clip. It is only the "rate of expansion" that is declining.
Iirc, the sites that track a continued M3 have shown a reversal of the rapid decline, and an increase in the last couple of months.
I am tracking M1 instead of M3 because that is the indicator Mish found to work best with the Kasriel indicator (you can track the links back to his blog where he discusses this).
Economists View answered my question
I was wondering about the history of M1 and it looks like the Economists View calculated it out, wrote up a nice post and even did a graph.
Wno Needs a New World Economic Order? After All.
Prepare for the New World Economic Order
Interest Rates [Credit] are the Cause and Consequence of the Explosion of Income/Wealth Disparities and, Hence, of the Inherent Instability of this Economy:
The Ominous Keynes' Liquidity Trap.
Origin of Economic Chaos.
Everyone Need an Economy, Don't They?
There Is One Solution That Works:
A Credit Free, Free Market Economy:
The New World Economic Order.
What Else?
The Only Goal of 1776 - Annuit Cœptis is to Implement It.
They Can Transfer Their Assets & Forget Their Liabilities.
Anyone Can Join But Still Needs to Ask for It.
http://www.17-76.net/
The Purpose Is to Provide Both a New Deal and a New Game.
It is NOT to Fix This Economy Which is Already Beyond Repair.
The Intention Is to Create a New Economy
With the Assets of the Old One Without its Liabilities.
Why Not Insure Against the Worst Case Scenario?